How long might you be stopped for a violation?
Analyzing Police Activity with pandas

Kevin Markham
Founder, Data School
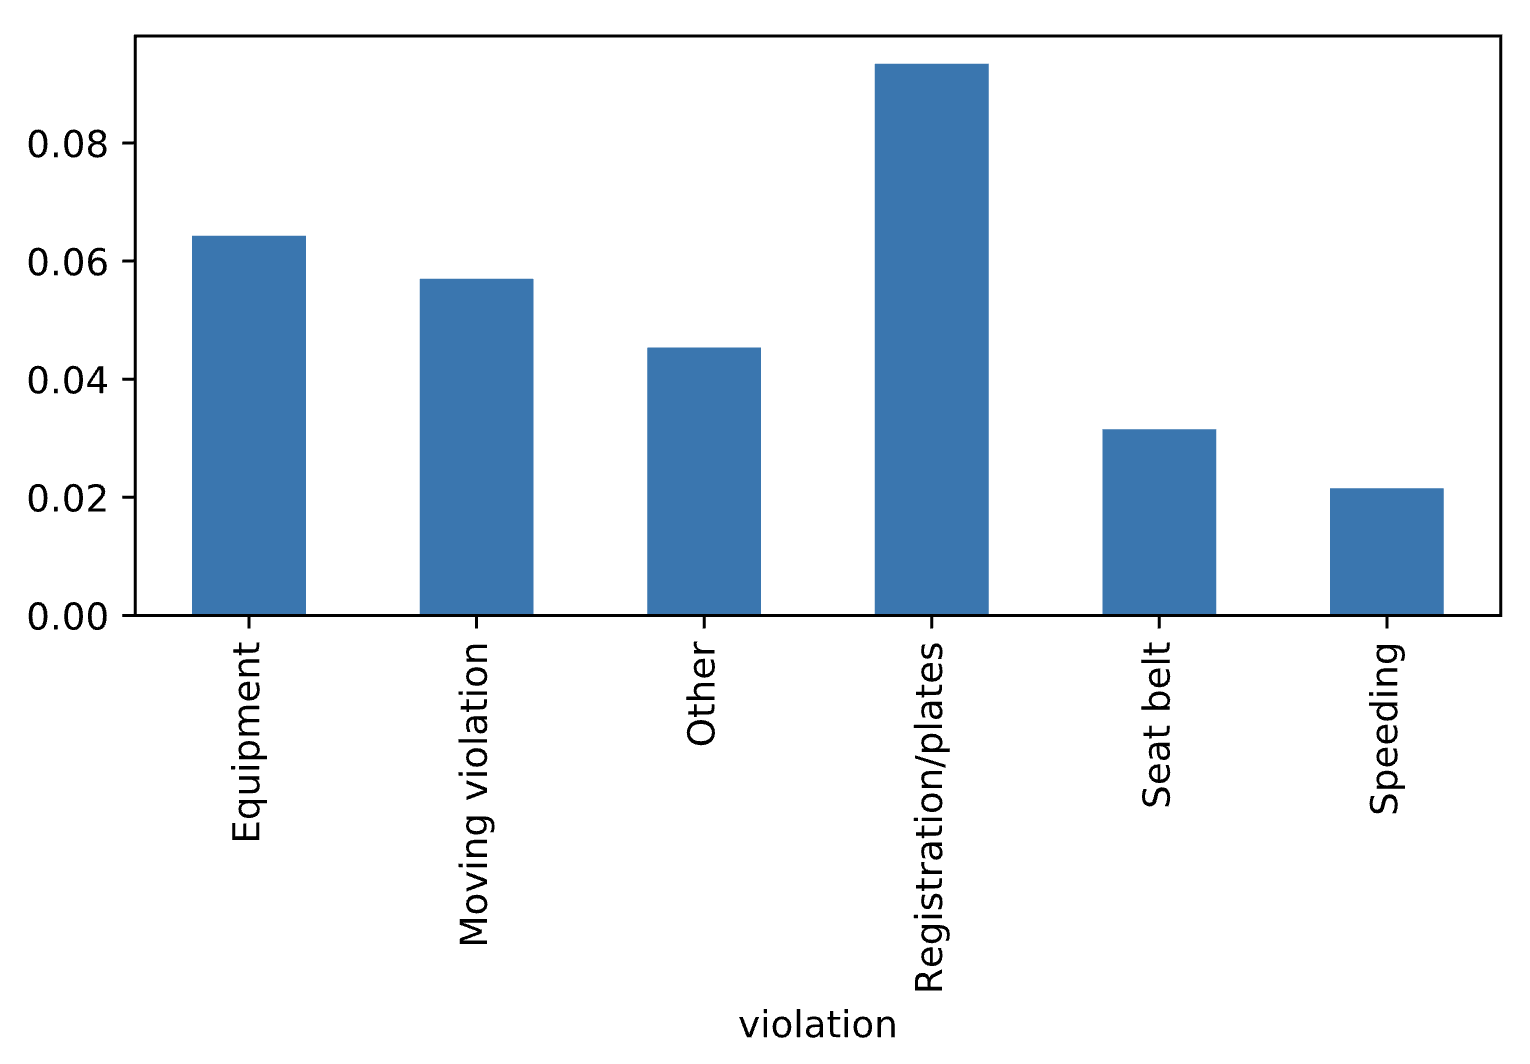
Creating a bar plot
search_rate.plot(kind='bar')
plt.show()
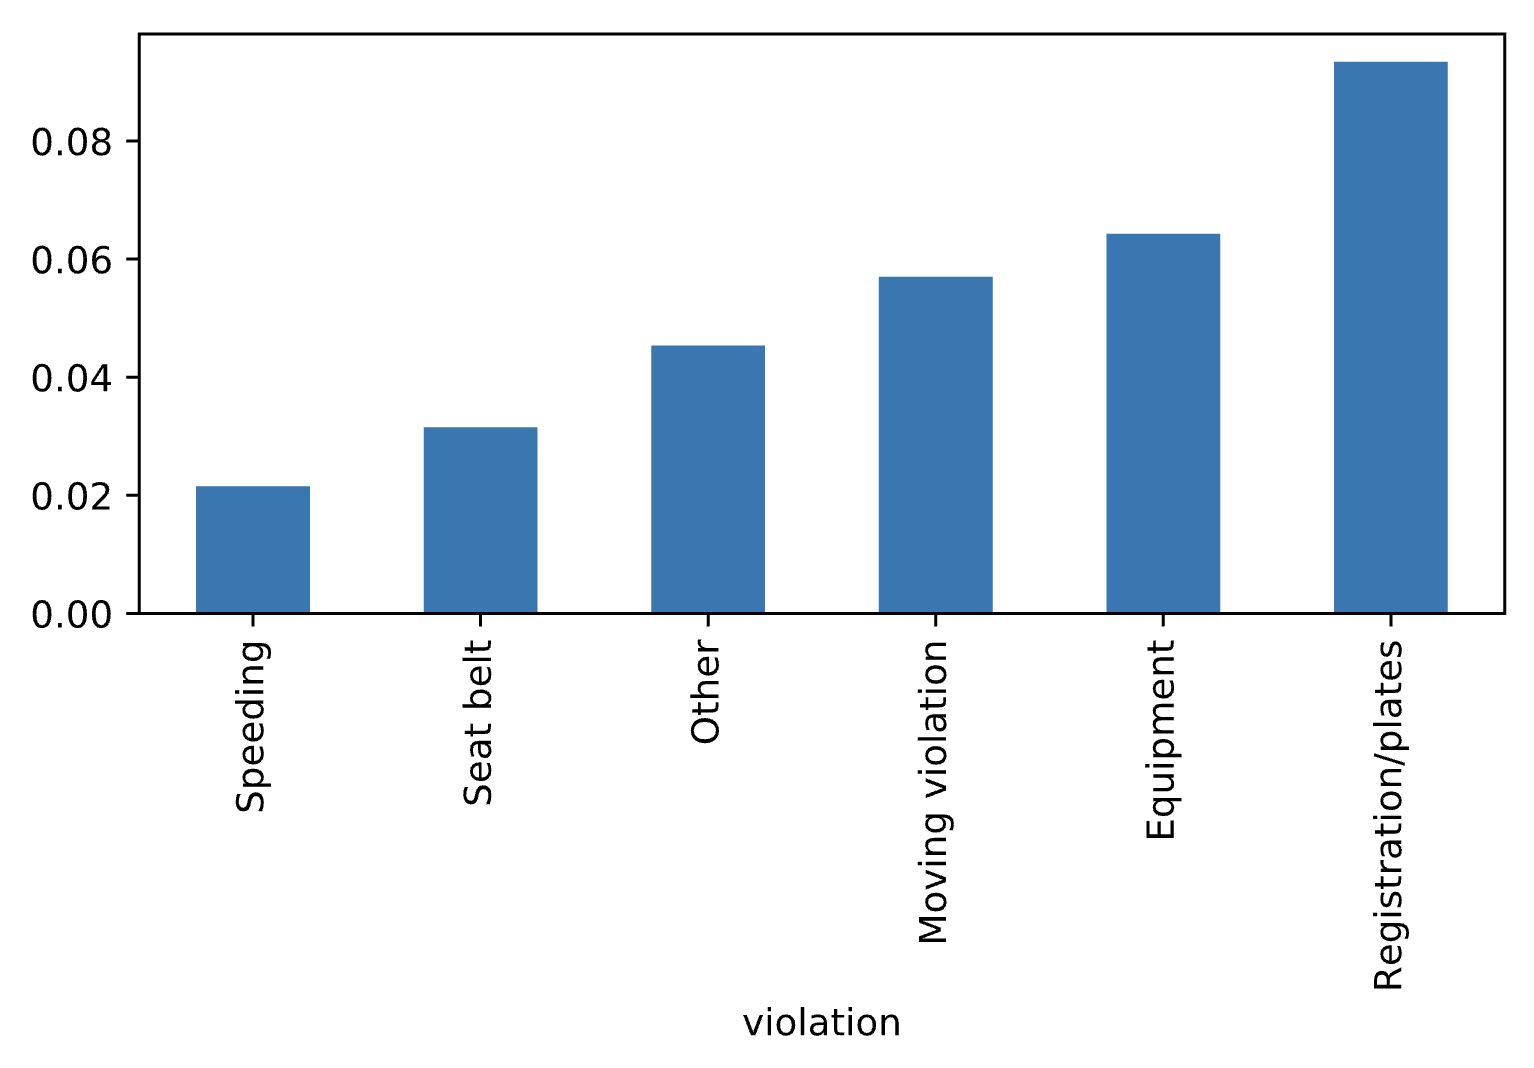
Ordering the bars (2)
search_rate.sort_values().plot(kind='bar')
plt.show()
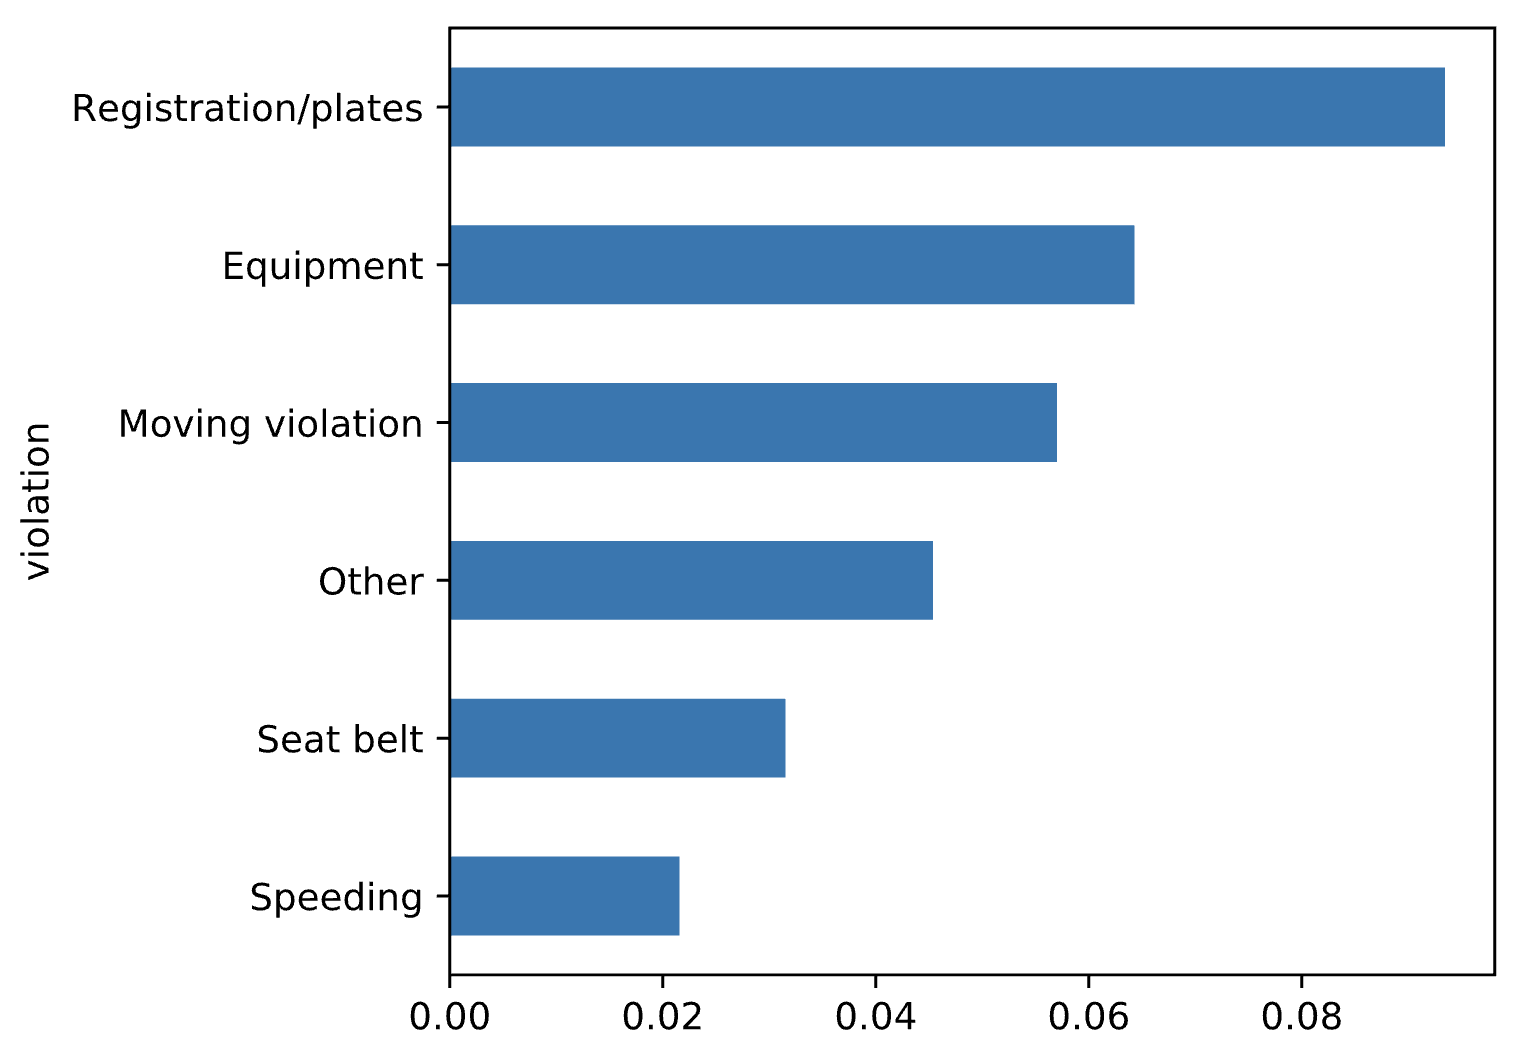
Rotating the bars
search_rate.sort_values().plot(kind='barh')
plt.show()