Plotting data with tigris and ggplot2

Analyzing US Census Data in R

Kyle Walker

Instructor

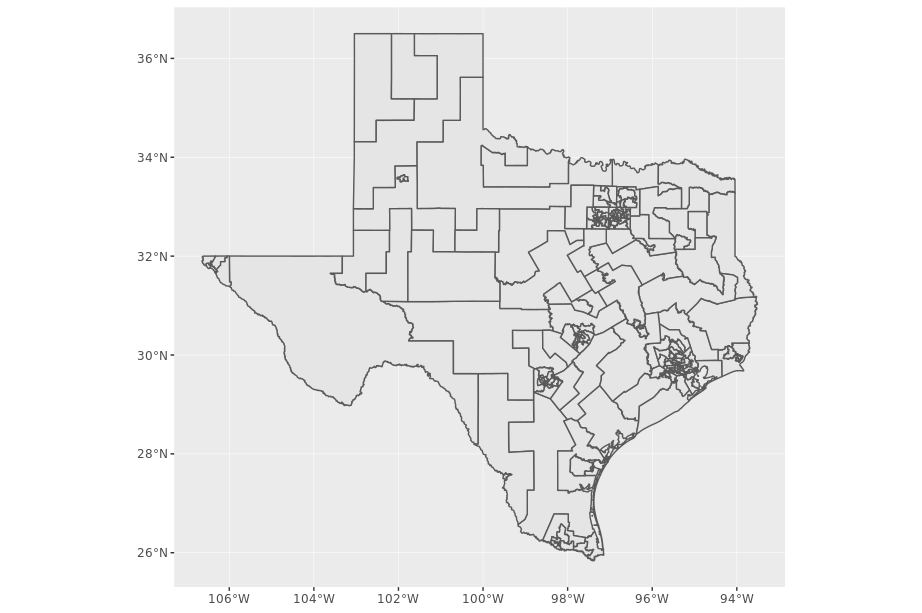
Plotting spatial data with geom_sf()

ggplot(tx_joined) + 
  geom_sf()

plot with geom_sf

Analyzing US Census Data in R

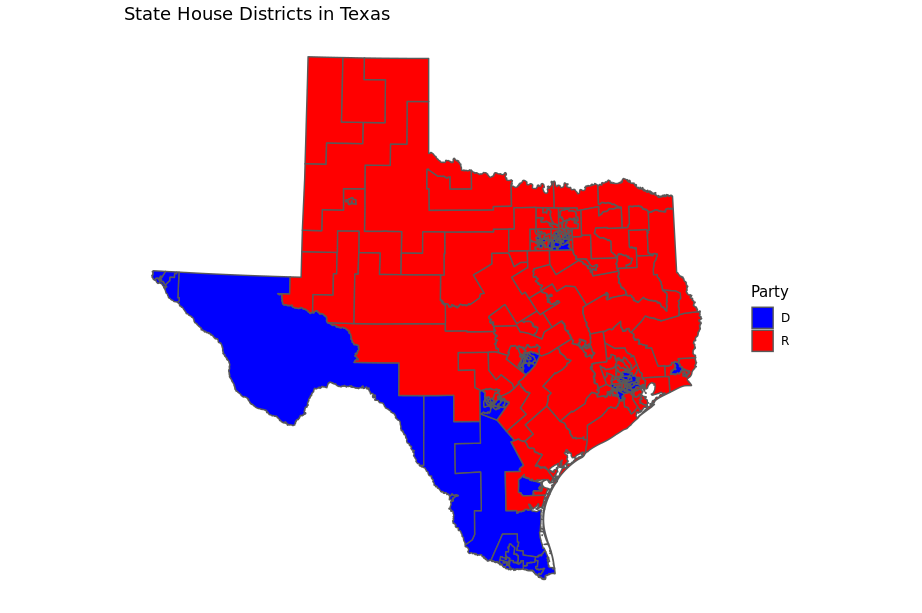
Setting the fill aesthetic for regions

ggplot(tx_joined, aes(fill = Party)) + 
  geom_sf()

filled plot with geom_sf

Analyzing US Census Data in R

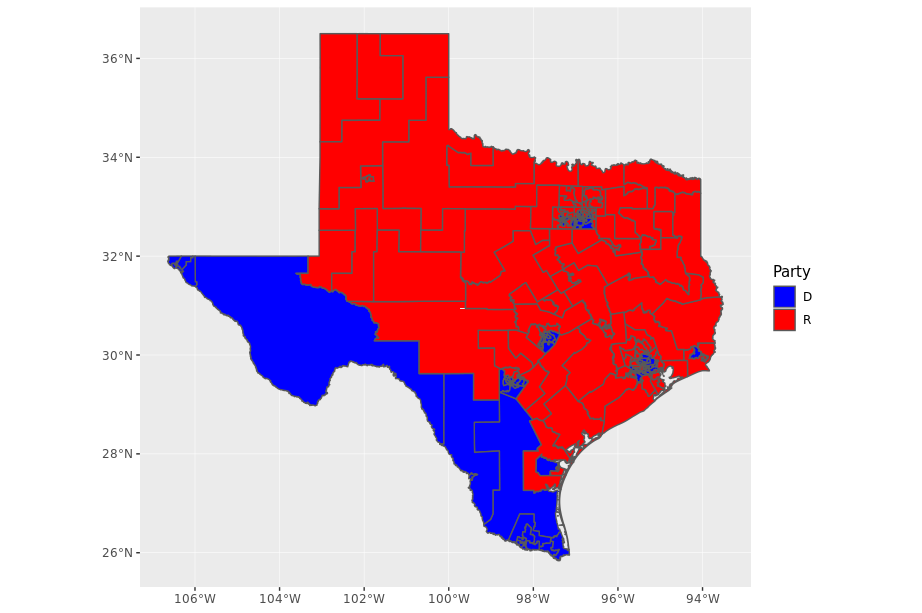
Customizing fill colors

ggplot(tx_joined, aes(fill = Party)) + 
  geom_sf() + 
  scale_fill_manual(values = c("R" = "red", "D" = "blue"))

correct colors with geom_sf

Analyzing US Census Data in R

Polishing up the output

ggplot(tx_joined, aes(fill = Party)) + 
  geom_sf() + 
  coord_sf(crs = 3083, datum = NA) + 
  scale_fill_manual(values = c("R" = "red", "D" = "blue")) + 
  theme_minimal() + 
  labs(title = "State House Districts in Texas")
Analyzing US Census Data in R

Polished spatial plot

Analyzing US Census Data in R

Let's practice!

Analyzing US Census Data in R

Preparing Video For Download...