Advanced demographic mapping
Analyzing US Census Data in R

Kyle Walker
Instructor
Visual variables in cartography
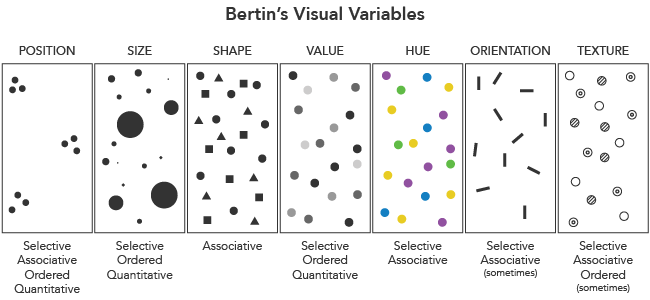
- Source: Axis Maps
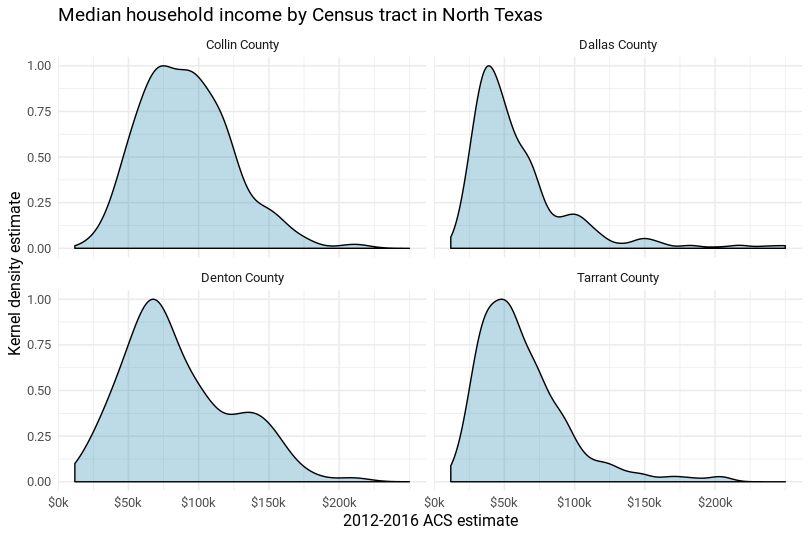
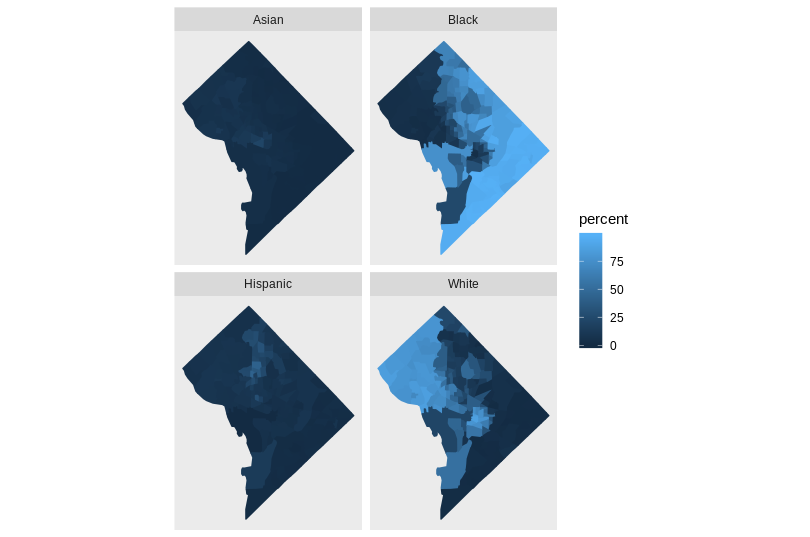
Faceted maps with ggplot2
ggplot(dc_race, aes(fill = percent, color = percent)) +
  geom_sf() +
  coord_sf(datum = NA) +
  facet_wrap(~variable)
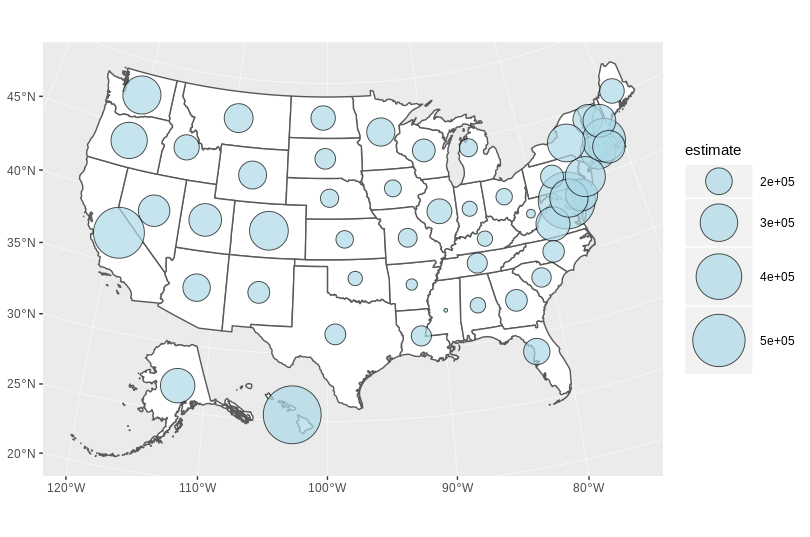
Interactive maps with mapview
library(mapview)
mapview(cook_value, zcol = "estimate", legend = TRUE)