Customizing tigris options
Analyzing US Census Data in R

Kyle Walker
Instructor
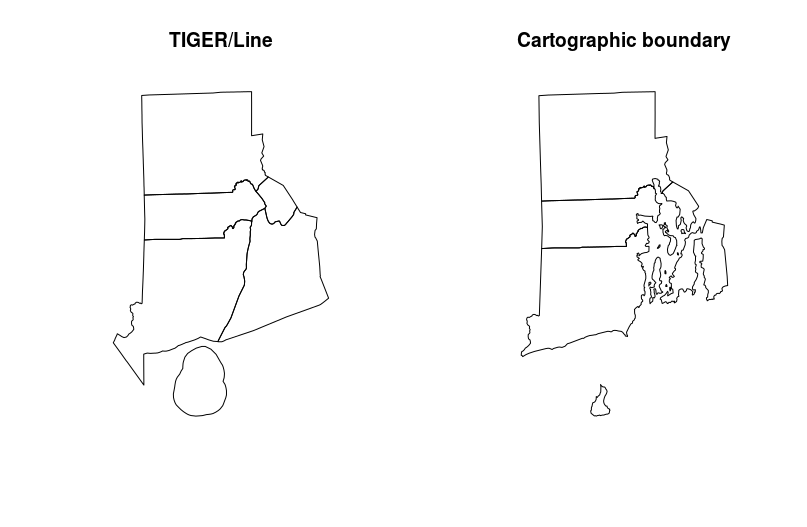
TIGER/Line vs. cartographic boundary files
ri_tiger <- counties("RI") ri_cb <- counties("RI", cb = TRUE)par(mfrow = c(1, 2)) plot(ri_tiger, main = "TIGER/Line") plot(ri_cb, main = "Cartographic boundary")