Introduction to Seaborn
Intermediate Data Visualization with Seaborn

Chris Moffitt
Instructor
Python Visualization Landscape
- The python visualization landscape is complex and can be overwhelming
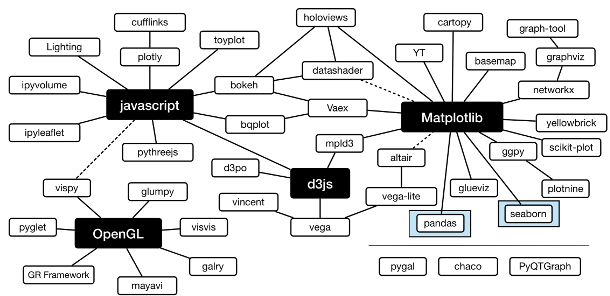
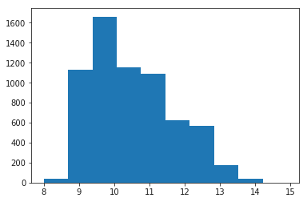
Matplotlib
matplotlibprovides the raw building blocks for Seaborn's visualizations- It can also be used on its own to plot data
import matplotlib.pyplot as plt import pandas as pddf = pd.read_csv("wines.csv")fig, ax = plt.subplots() ax.hist(df['alcohol'])
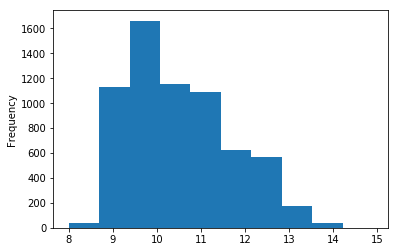
Pandas
pandasis a foundational library for analyzing data- It also supports basic plotting capability
import pandas as pddf = pd.read_csv("wines.csv") df['alcohol'].plot.hist()
Seaborn histplot
- The
histplotis similar to the histogram shown in previous examples - By default, generates a histogram but can also generate other complex plots
import seaborn as snssns.histplot(df['alcohol'])
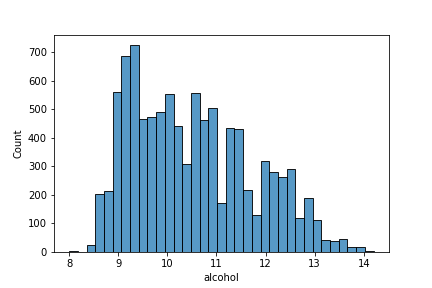
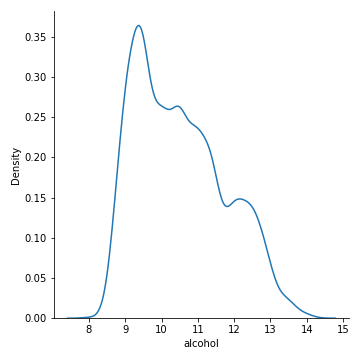
Seaborn displot
- The
displotleverages thehistplotand other functions for distribution plots - By default, it generates a histogram but can also generate other plot types
import seaborn as snssns.displot(df['alcohol'], kind='kde')
pandas Histogram vs. Displot
- Pandas histogram
df['alcohol'].plot.hist()- Actual frequency of observations
- No outline of bars
- Wide bins
- No x-axis label
- Seaborn displot
sns.displot(df['alcohol'])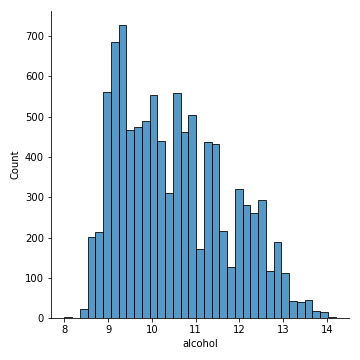
- Automatic label on x-axis
- Muted color palette
- Cleaner plot

