Selecting Seaborn Plots
Intermediate Data Visualization with Seaborn

Chris Moffitt
Instructor
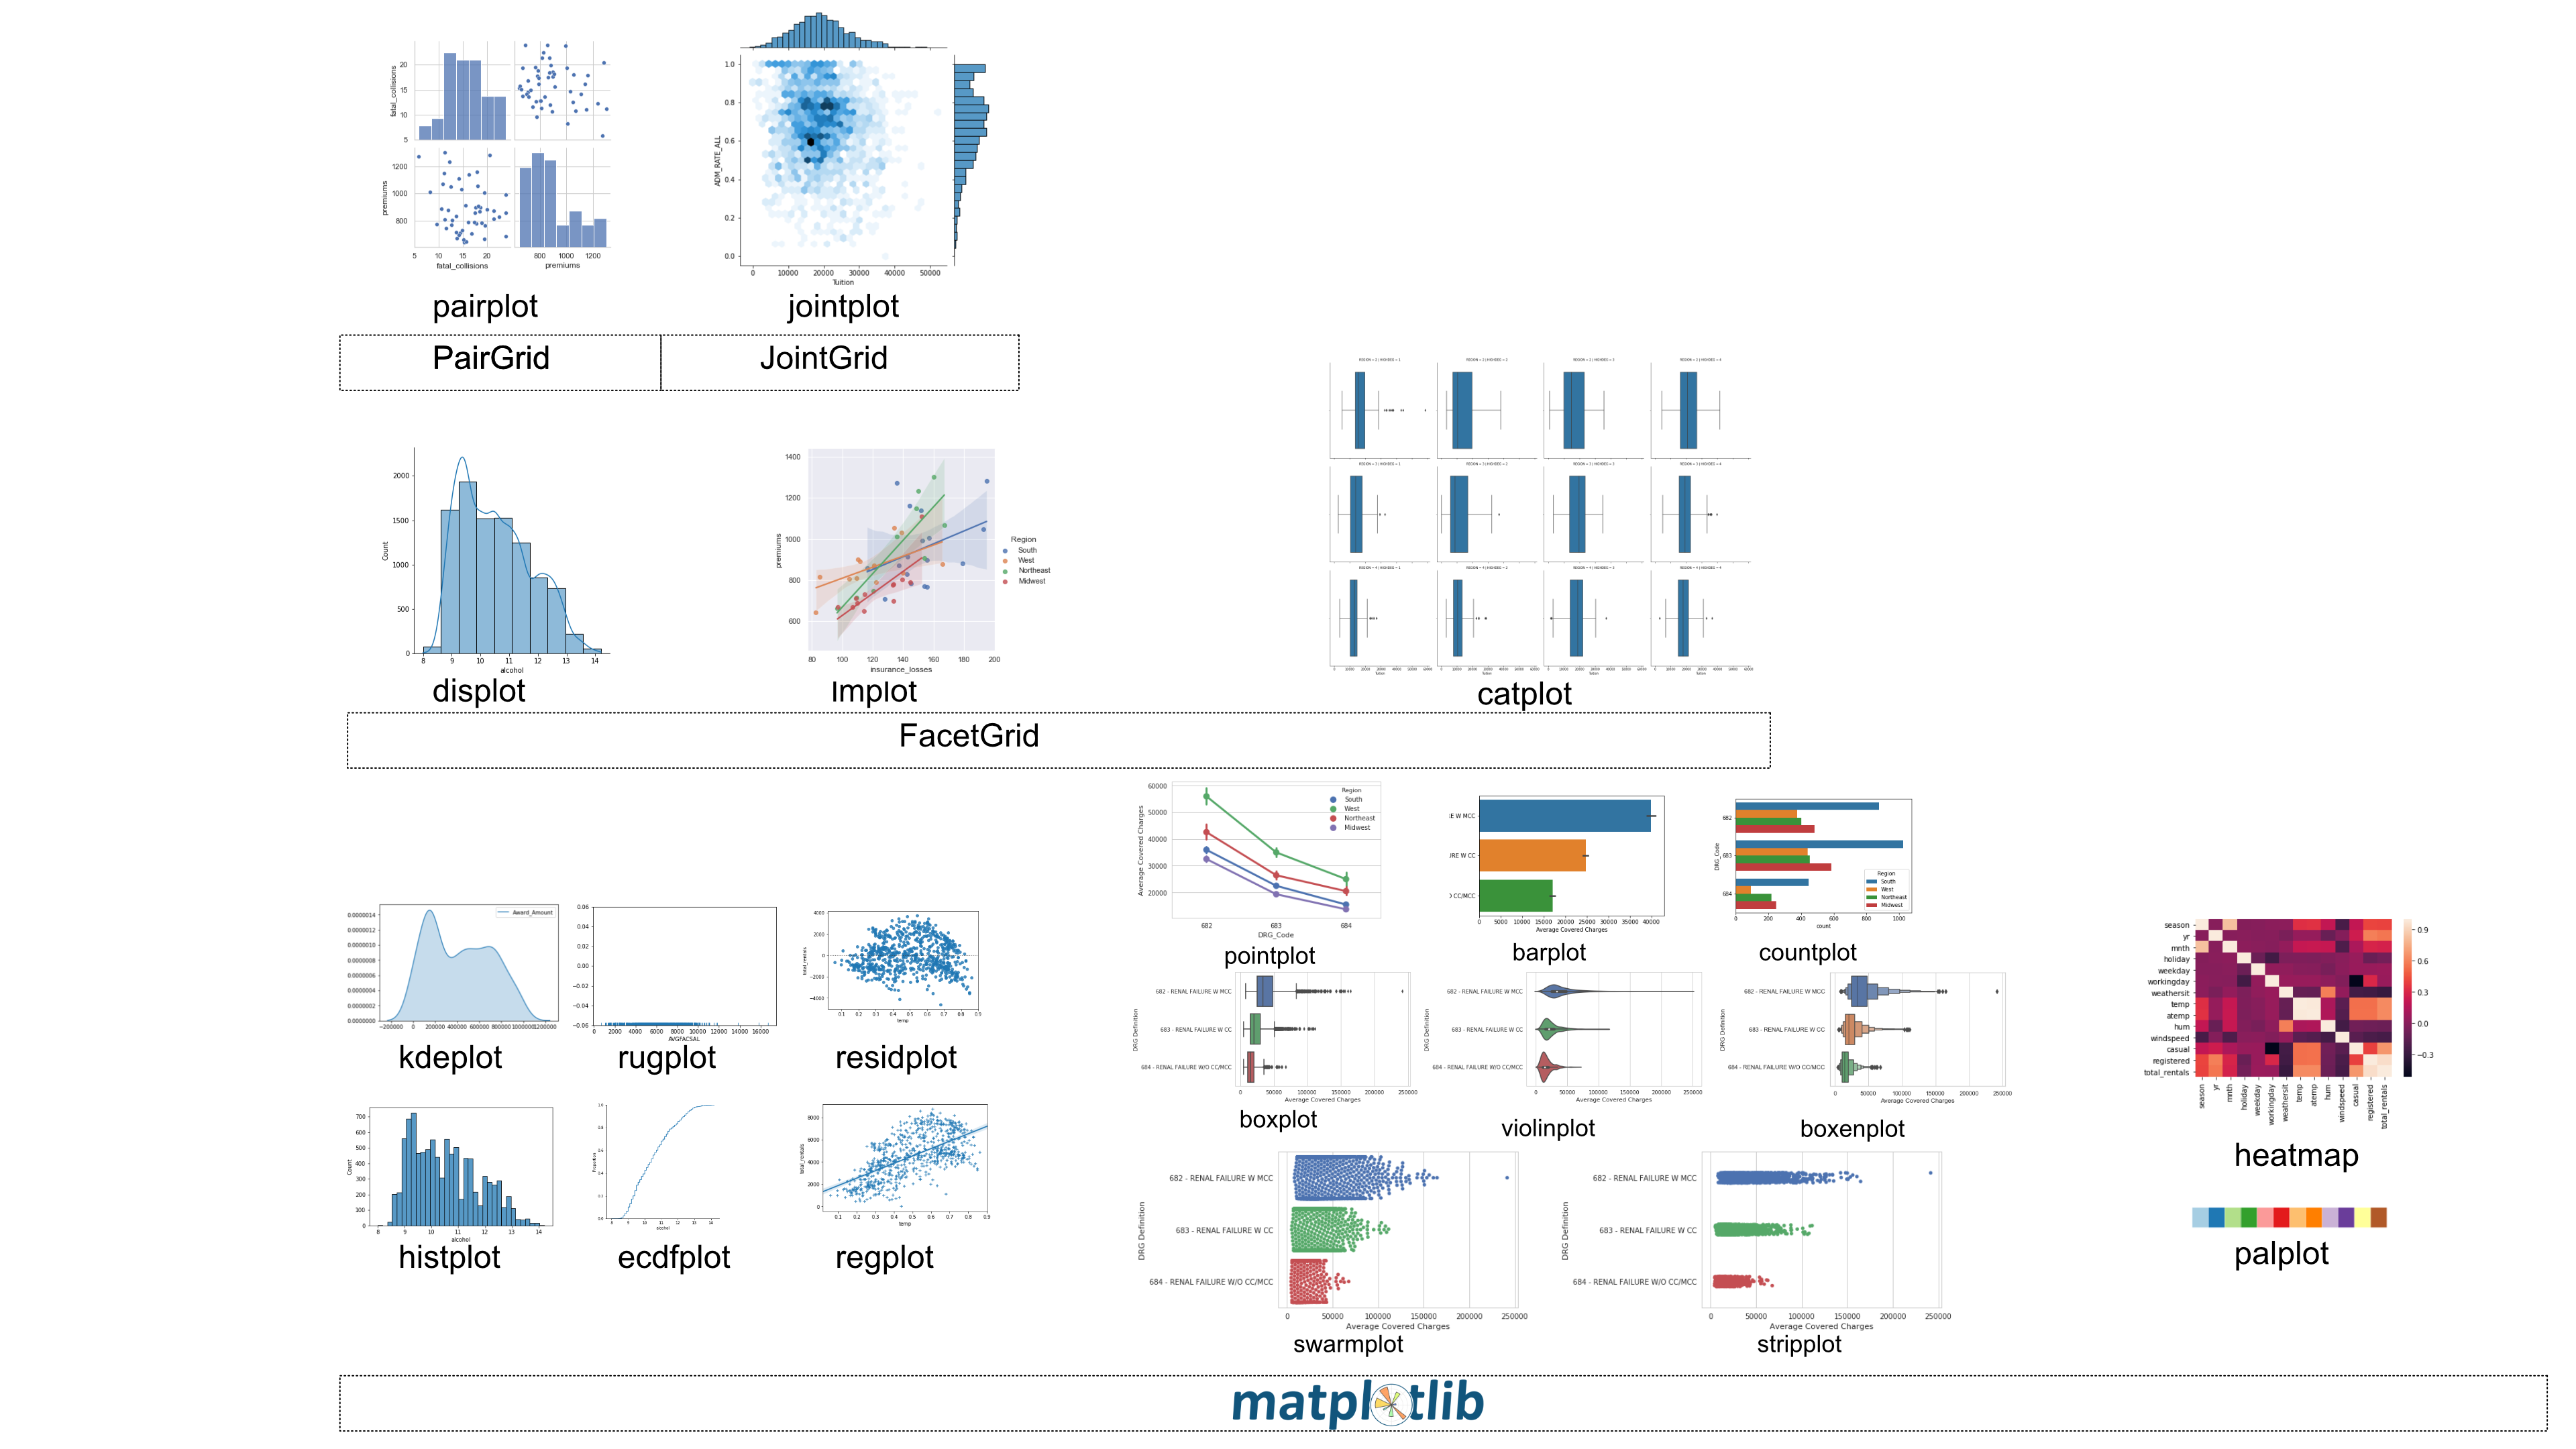
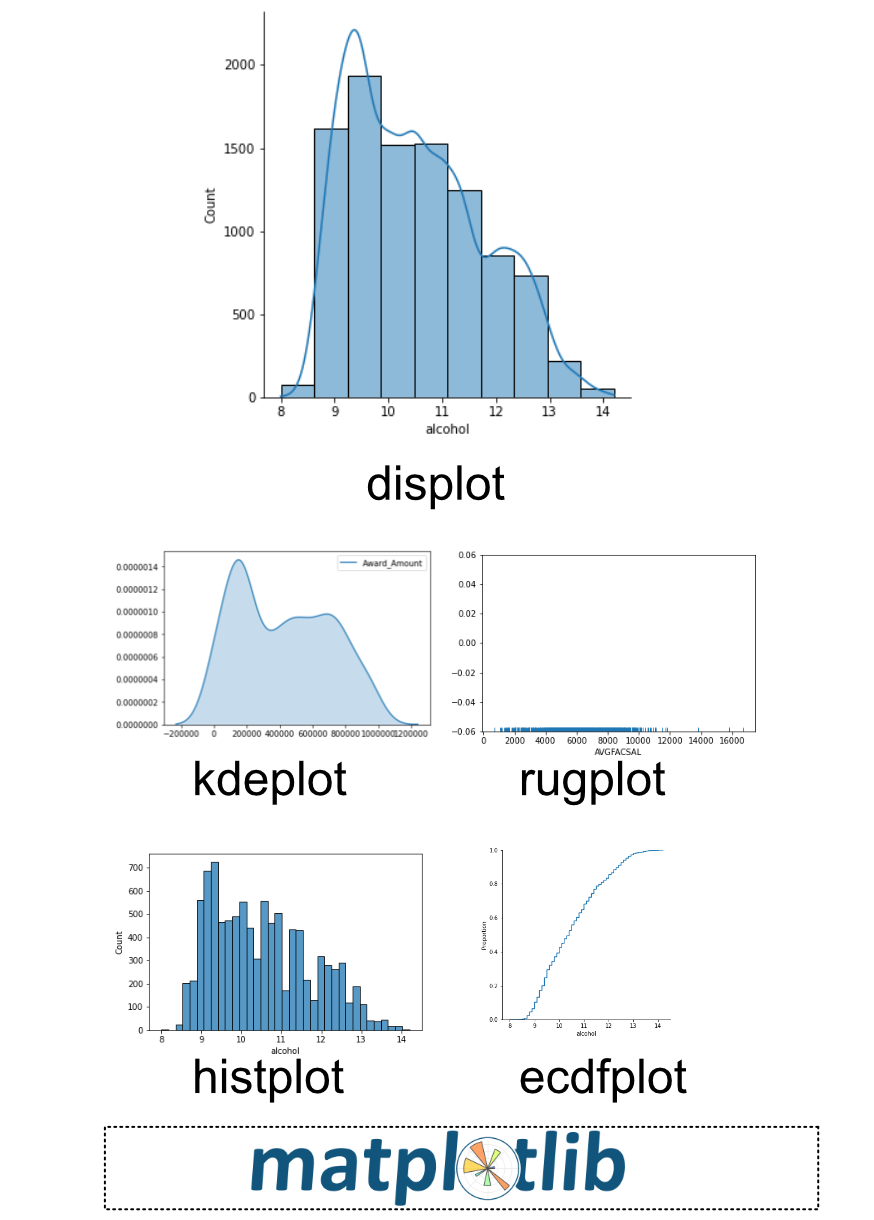
Univariate Distribution Analysis
displot()is the best place to start for this analysisrugplot(),kdeplot()andecdfplot()can be useful alternatives
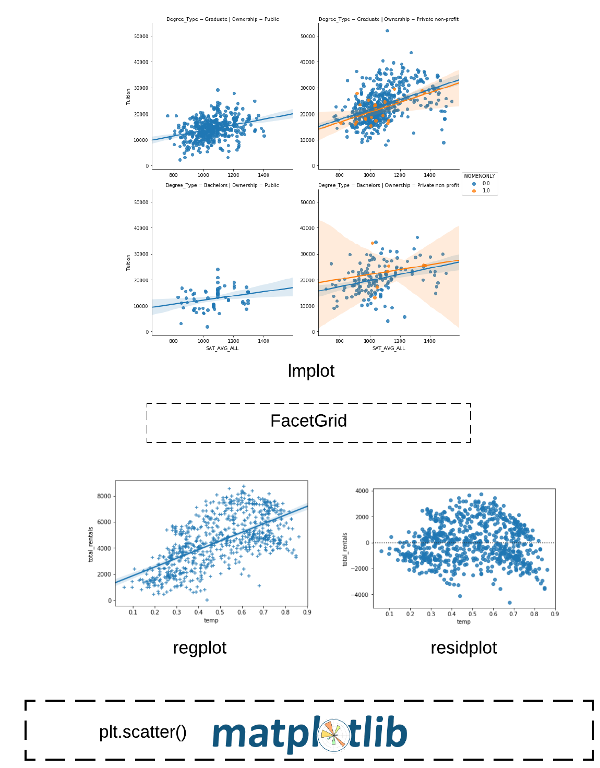
Regression Analysis
lmplot()performs regression analysis and supports facetting
Categorical Plots
- Explore data with the categorical plots and facet with
catplot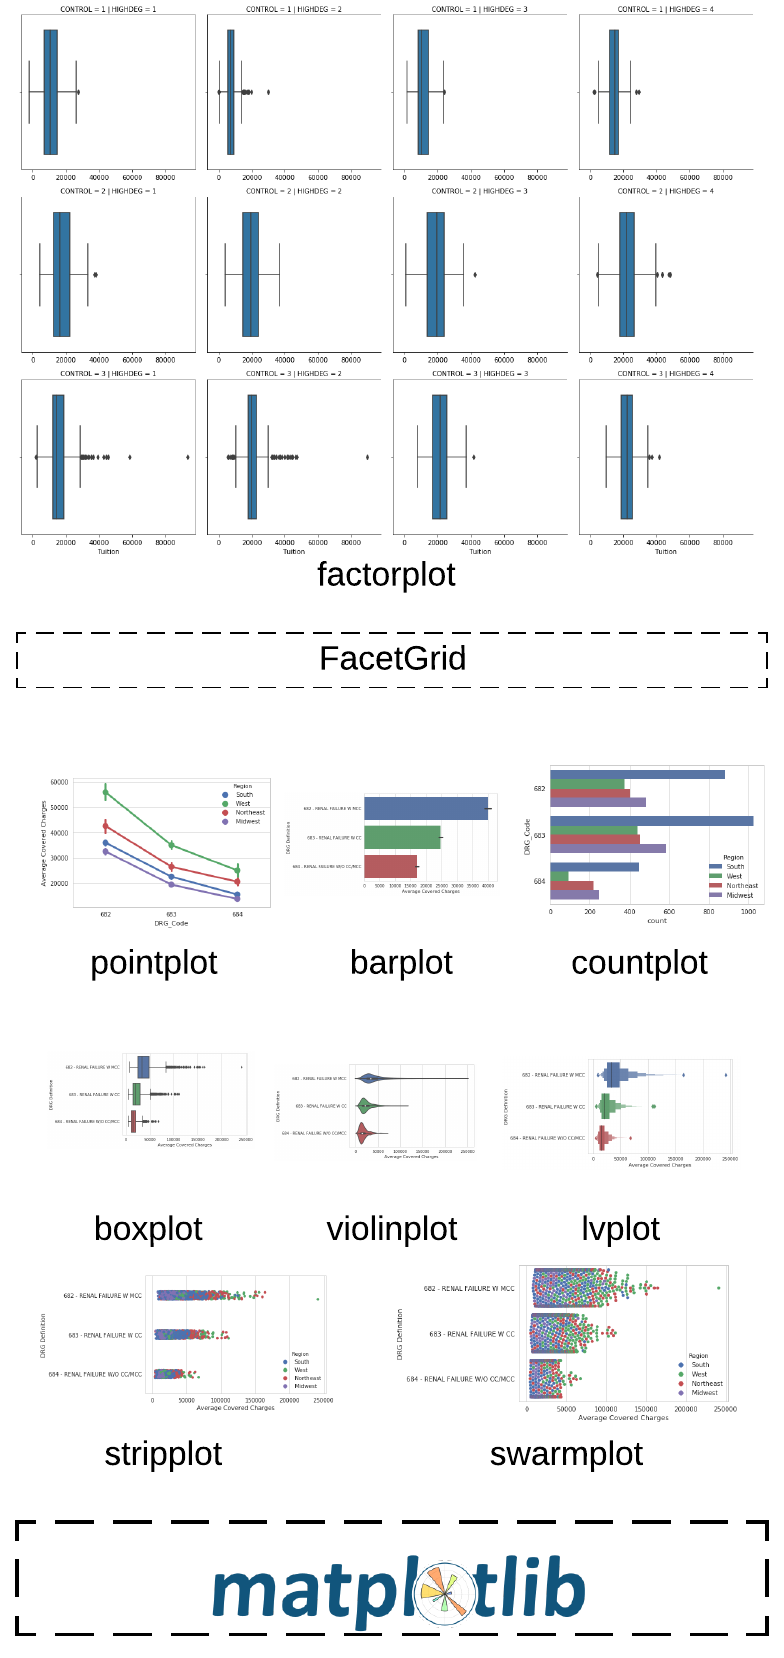
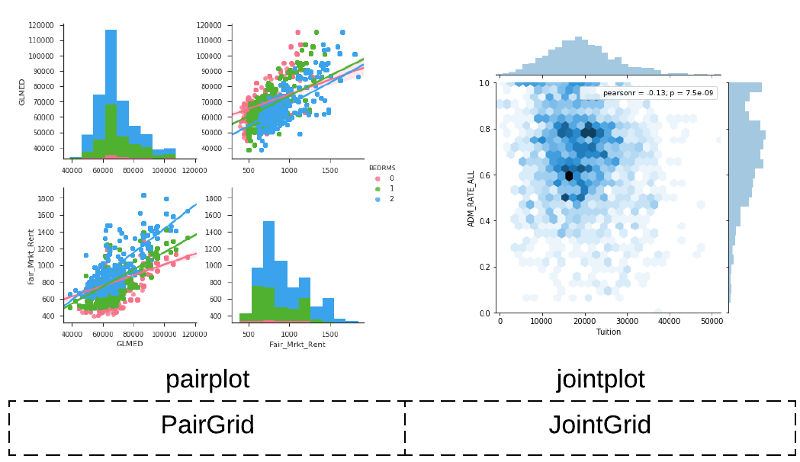
pairplot() and jointplot()
- Perform regression analysis with
lmplot - Analyze distributions with
displot