Colors in Seaborn
Intermediate Data Visualization with Seaborn

Chris Moffitt
Instructor
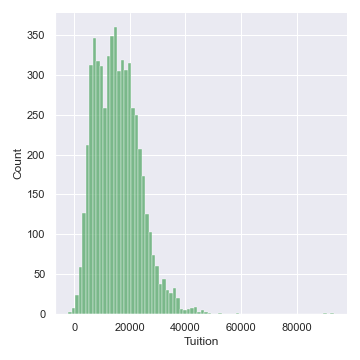
Defining a color for a plot
- Seaborn supports assigning colors to plots using
matplotlibcolor codes
sns.set(color_codes=True)
sns.displot(df['Tuition'], color='g')
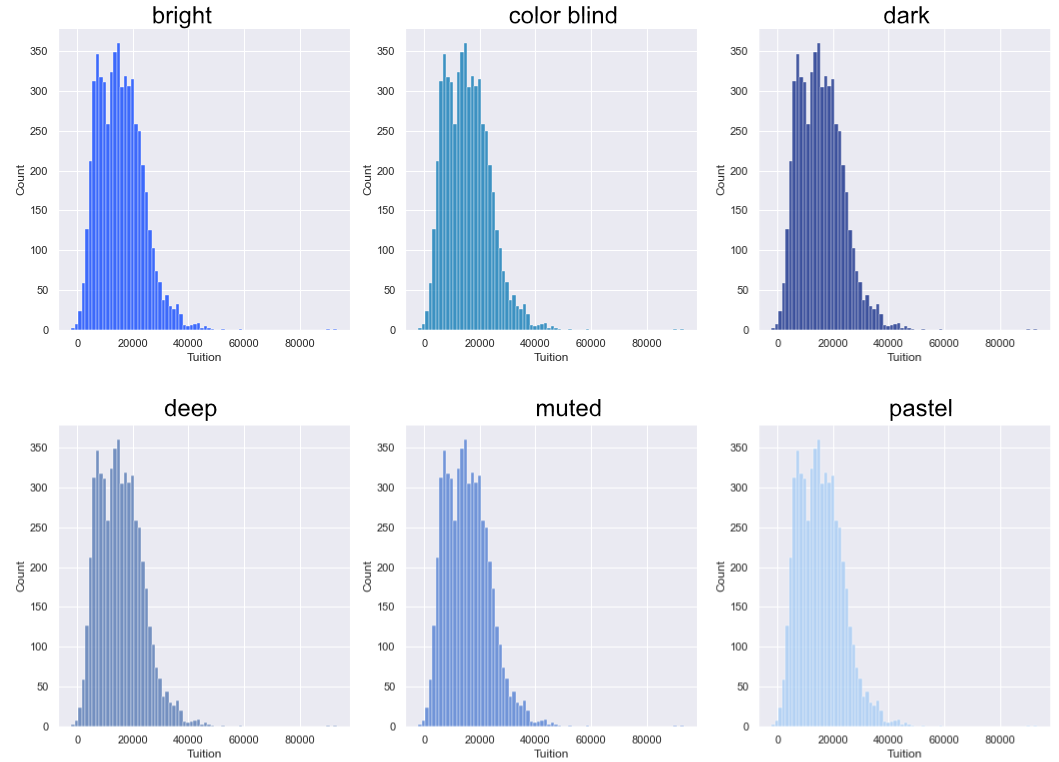
Palettes
- Seaborn uses the
set_palette()function to define a palette
palettes = ['deep', 'muted', 'pastel', 'bright', 'dark','colorblind']
for p in palettes:
    sns.set_palette(p)
    sns.displot(df['Tuition'])
Displaying Palettes
sns.palplot()function displays a palettesns.color_palette()returns the current palette
palettes = ['deep', 'muted', 'pastel', 'bright','dark','colorblind']
for p in palettes:
    sns.set_palette(p)
    sns.palplot(sns.color_palette())
    plt.show()

Defining Custom Palettes
- Circular colors = when the data is not ordered
sns.palplot(sns.color_palette("Paired", 12))

- Sequential colors = when the data has a consistent range from high to low
sns.palplot(sns.color_palette("Blues", 12))

- Diverging colors = when both the low and high values are interesting
sns.palplot(sns.color_palette("BrBG", 12))