Regression Plots
Intermediate Data Visualization with Seaborn

Chris Moffitt
Instructor
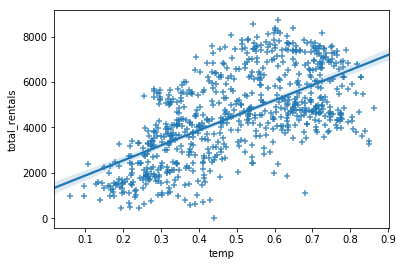
Plotting with regplot()
sns.regplot(data=df, x='temp',
            y='total_rentals', marker='+')
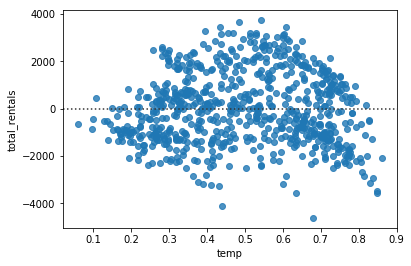
Evaluating regression with residplot()
- A residual plot is useful for evaluating the fit of a model
- Seaborn supports through
residplotfunction
sns.residplot(data=df, x='temp', y='total_rentals')
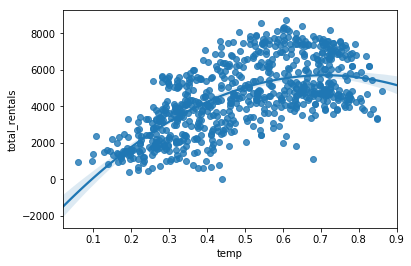
Polynomial regression
- Seaborn supports polynomial regression using the
orderparameter
sns.regplot(data=df, x='temp',
            y='total_rentals', order=2)
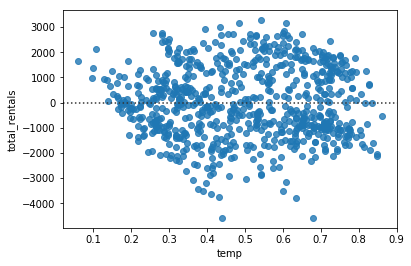
residplot with polynomial regression
sns.residplot(data=df, x='temp',
              y='total_rentals', order=2)
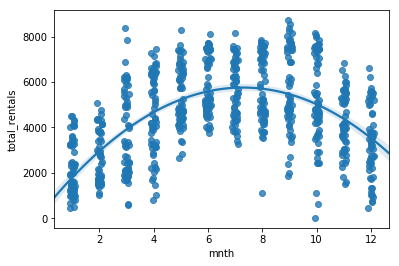
Categorical values
sns.regplot(data=df, x='mnth', y='total_rentals',
            x_jitter=.1, order=2)
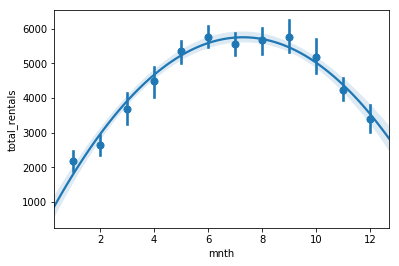
Estimators
- In some cases, an
x_estimatorcan be useful for highlighting trends
sns.regplot(data=df, x='mnth', y='total_rentals',
            x_estimator=np.mean, order=2)
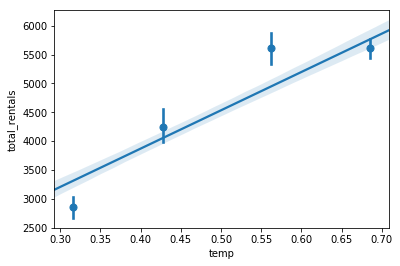
Binning the data
x_binscan be used to divide the data into discrete bins- The regression line is still fit against all the data
sns.regplot(data=df,x='temp',y='total_rentals',
            x_bins=4)