Customizing with matplotlib
Intermediate Data Visualization with Seaborn

Chris Moffitt
Instructor
Matplotlib Axes
- Most customization available through
matplotlibAxesobjects Axescan be passed to seaborn functions
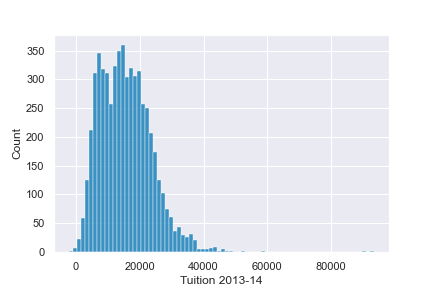
fig, ax = plt.subplots()
sns.histplot(df['Tuition'], ax=ax)
ax.set(xlabel='Tuition 2013-14')
Further Customizations
- The
axesobject supports many common customizations
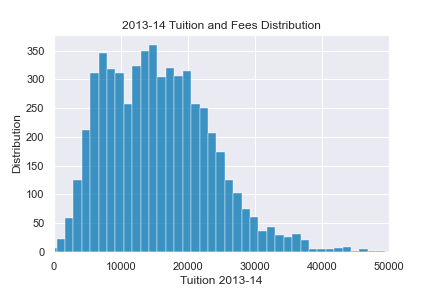
fig, ax = plt.subplots()
sns.histplot(df['Tuition'], ax=ax)
ax.set(xlabel="Tuition 2013-14",
       ylabel="Distribution", xlim=(0, 50000),
title="2013-14 Tuition and Fees Distribution")
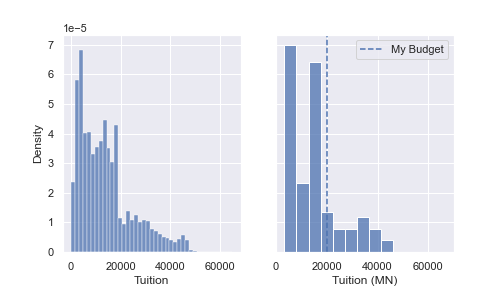
Combining Plots