Labeled anomalies

Introduction to Anomaly Detection in R

Alastair Rushworth

Data Scientist

Satellite image data

head(sat, 5)
  label V1  V2  V3 V4 V5
1     0 92 115 120 94 84
2     0 84 102 106 79 84
3     0 84 102 102 83 80
4     0 80 102 102 79 84
5     0 84  94 102 79 80
Introduction to Anomaly Detection in R

Satellite image data

table(sat$label)
   0    1 
5732   71

Cotton crop image proportion:

71 / 5803
0.01223505
Introduction to Anomaly Detection in R

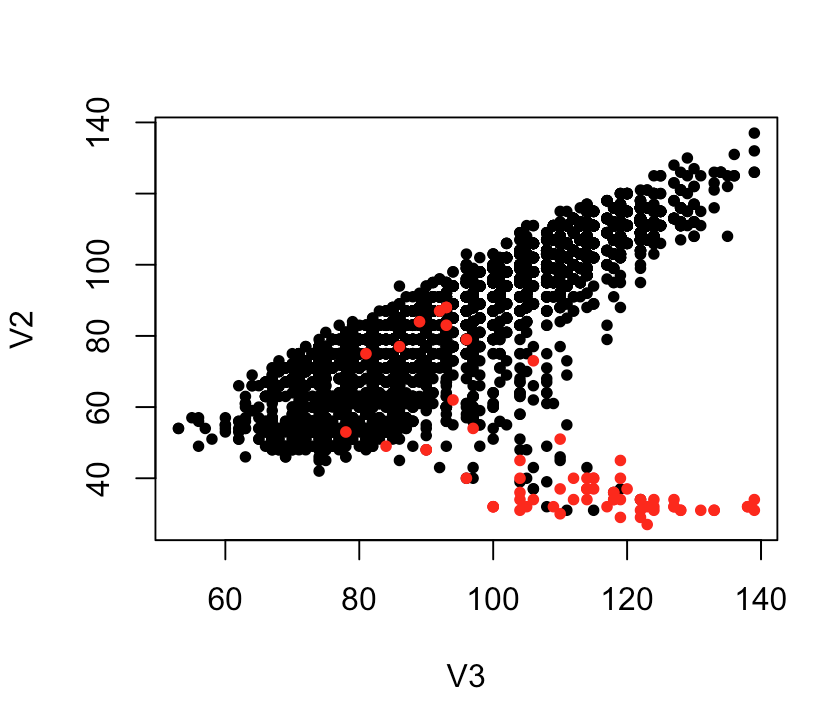
Visualize true anomalies

plot(V2 ~ V3, data = sat, col = as.factor(label), pch = 20)

Introduction to Anomaly Detection in R

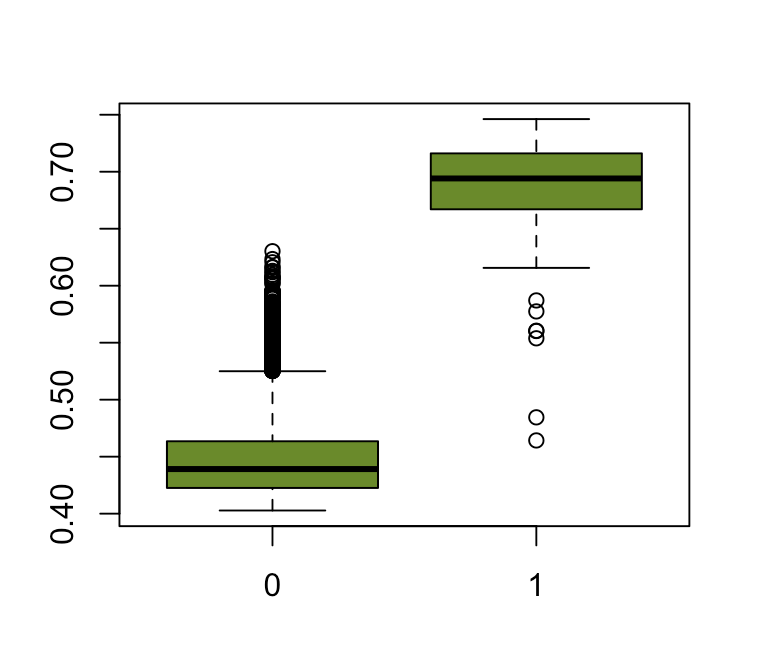
Anomaly score versus true label

sat_for <- iForest(sat[, -1], nt = 100)
sat$score <- predict(sat_for, features)

boxplot(score ~ label, data = sat, col = "olivedrab4")

Introduction to Anomaly Detection in R

Why not use models to predict labels?

Example 1: Detecting rare disease cases

  • Too few cases


Example 2: Credit card fraud

  • Changes rapidly
Introduction to Anomaly Detection in R

Let's practice!

Introduction to Anomaly Detection in R

Preparing Video For Download...