What is an anomaly?

Introduction to Anomaly Detection in R

Alastair Rushworth

Data Scientist

Defining the term anomaly

Anomaly: a data point or collection of data points that do not follow the same pattern or have the same structure as the rest of the data

Introduction to Anomaly Detection in R

Point anomaly

  • A single data point
  • Unusual when compared to the rest of the data


Example: A single 30C daily high temperature among a set of ordinary spring days

summary(temperature)
   Min. 1st Qu.  Median    Mean 3rd Qu.    Max. 
  18.00   20.45   22.45   22.30   22.98   30.00
Introduction to Anomaly Detection in R

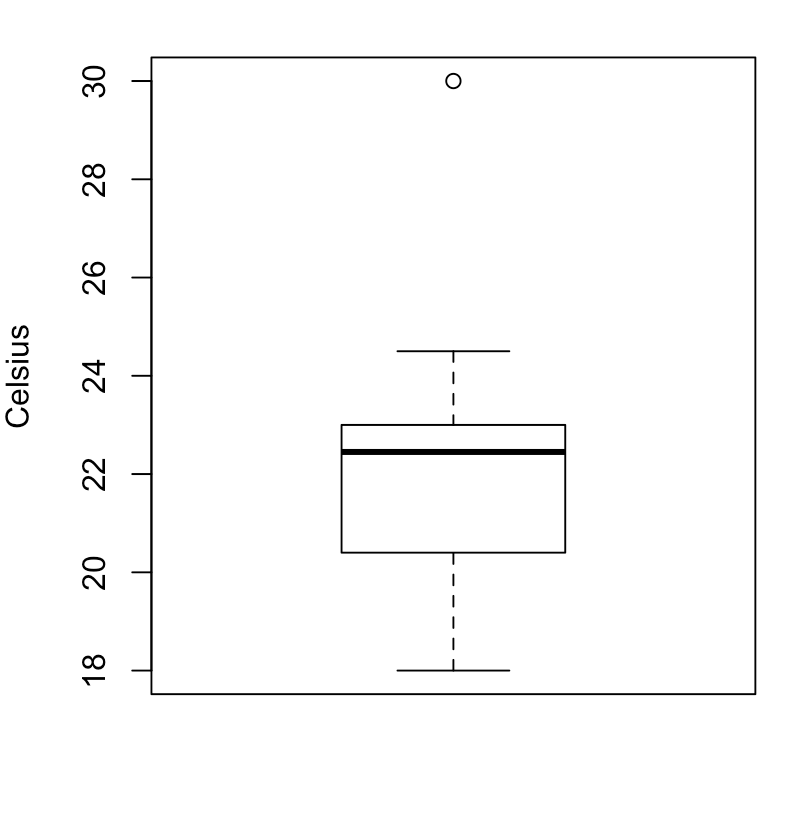
Visualizing point anomalies with a boxplot

boxplot(temperature, ylab = "Celsius")
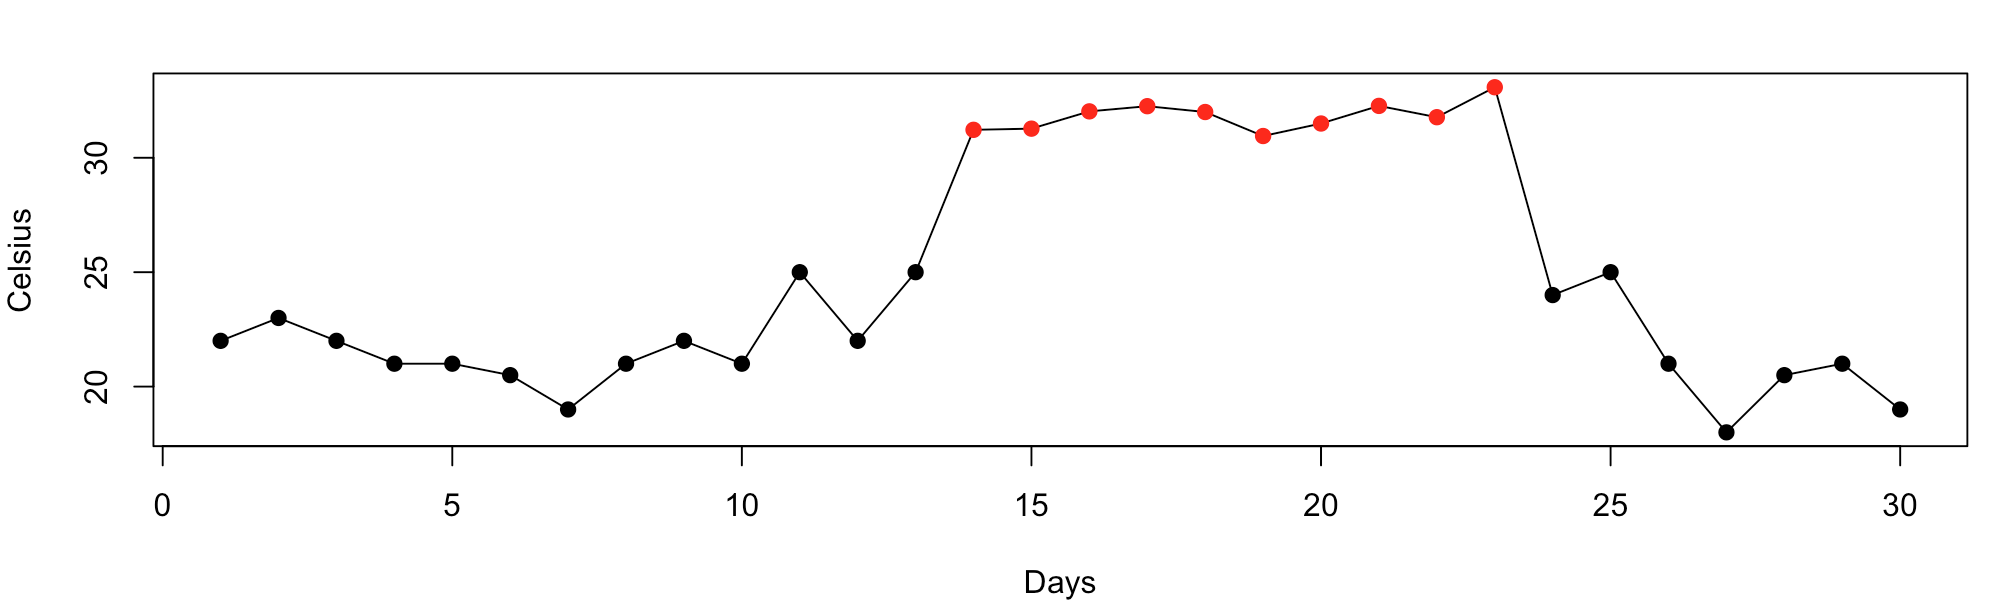
Introduction to Anomaly Detection in R

Collective anomaly

  • An anomalous collection of data instances
  • Unusual when considered together


Example: 10 consecutive high daily temperatures

Introduction to Anomaly Detection in R

Let's practice!

Introduction to Anomaly Detection in R

Preparing Video For Download...