Visualizing the isolation score
Introduction to Anomaly Detection in R

Alastair Rushworth
Data Scientist
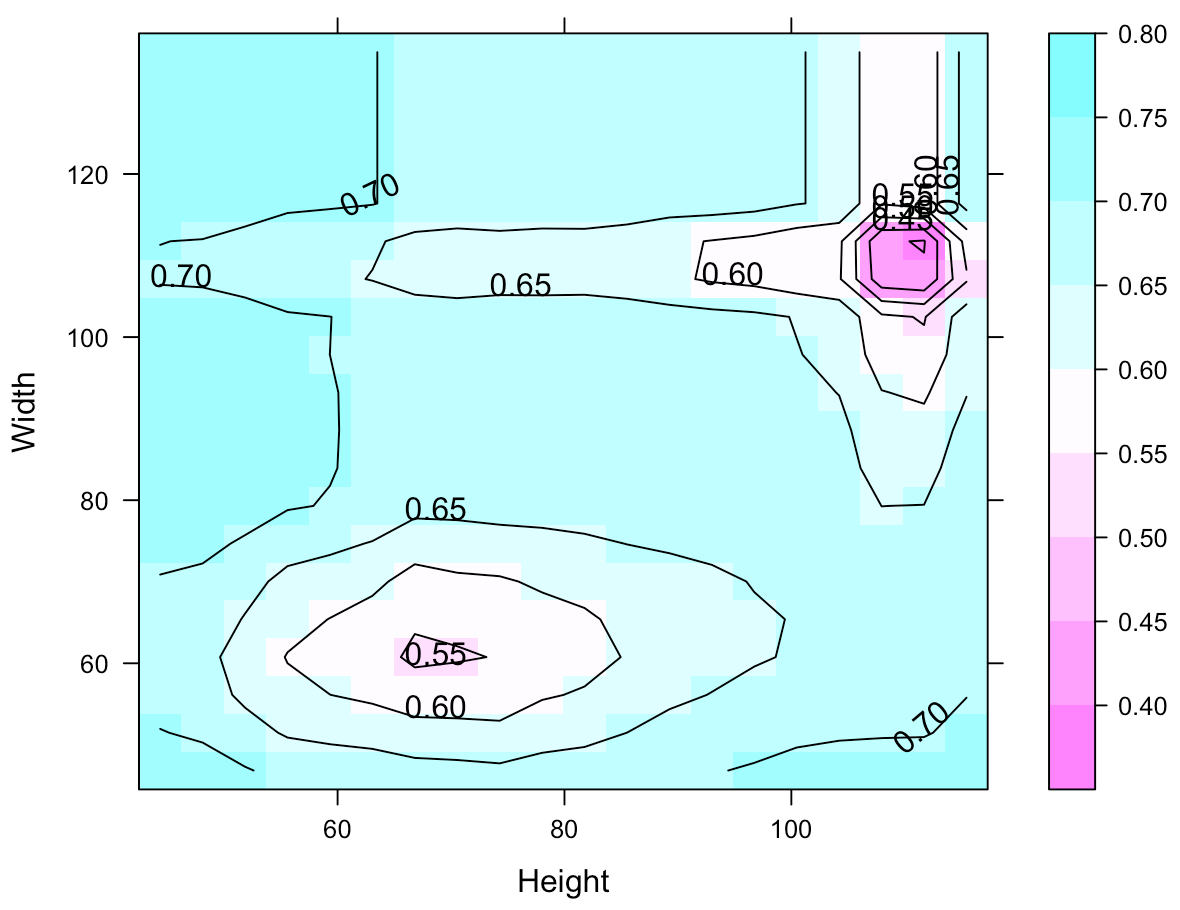
Make the contour plot!
library(lattice)
contourplot(score ~ Height + Width, data = furniture_grid,
            region = TRUE)
Introduction to Anomaly Detection in R
Alastair Rushworth
Data Scientist
library(lattice)
contourplot(score ~ Height + Width, data = furniture_grid,
region = TRUE)

