Testing the extremes with Grubbs' test
Introduction to Anomaly Detection in R

Alastair Rushworth
Data Scientist
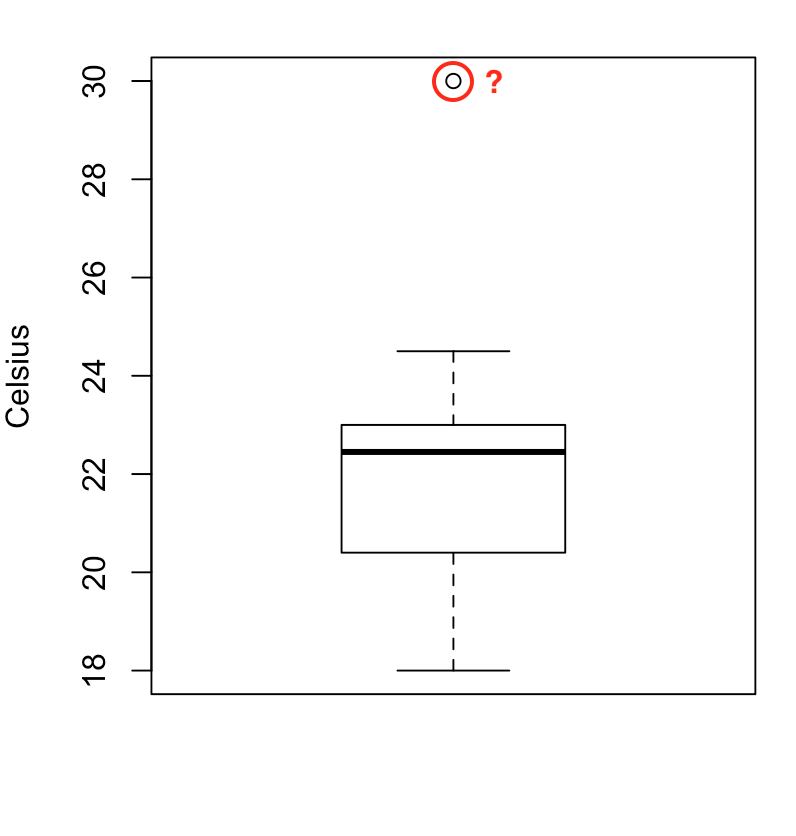
Visual assessment is not always reliable!
boxplot(temperature, ylab = "Celsius")
Checking normality with a histogram
hist(temperature, breaks = 6)
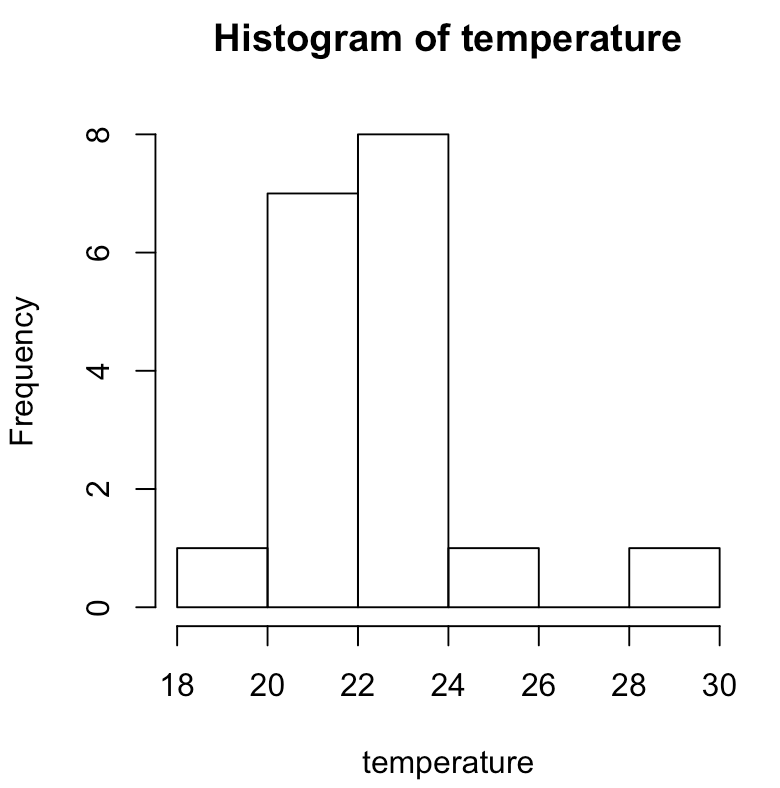
Symmetrical & bell shaped?

