Detecting multiple anomalies in seasonal time series
Introduction to Anomaly Detection in R

Alastair Rushworth
Data Scientist
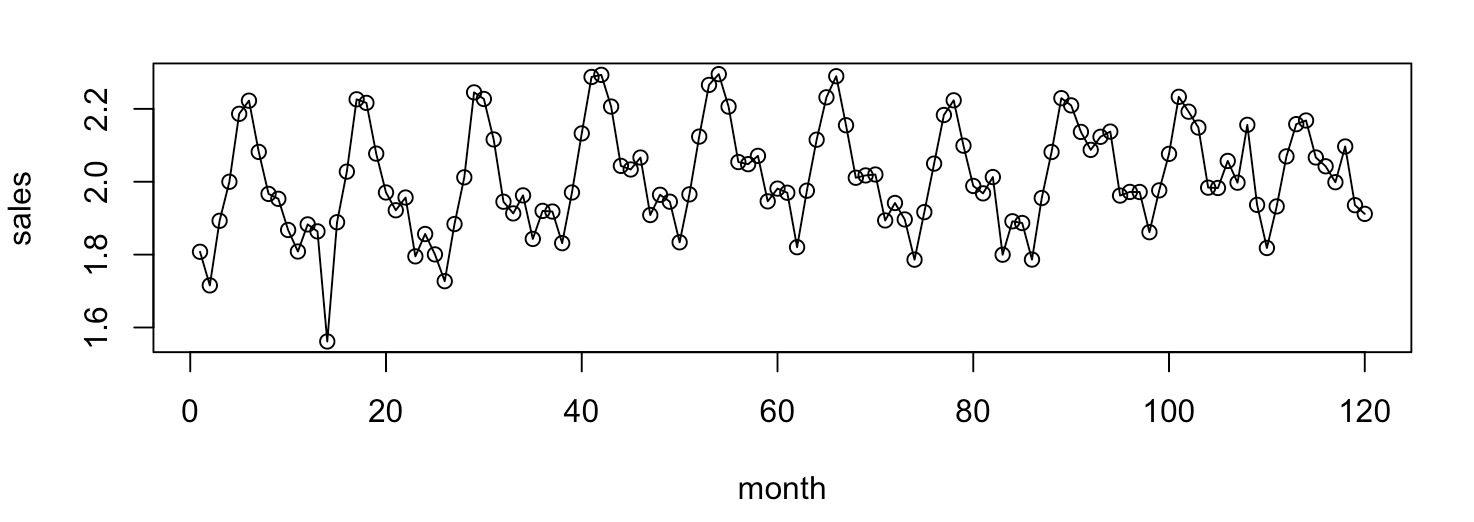
Visualizing monthly revenue
plot(sales ~ month, data = msales, type = 'o')
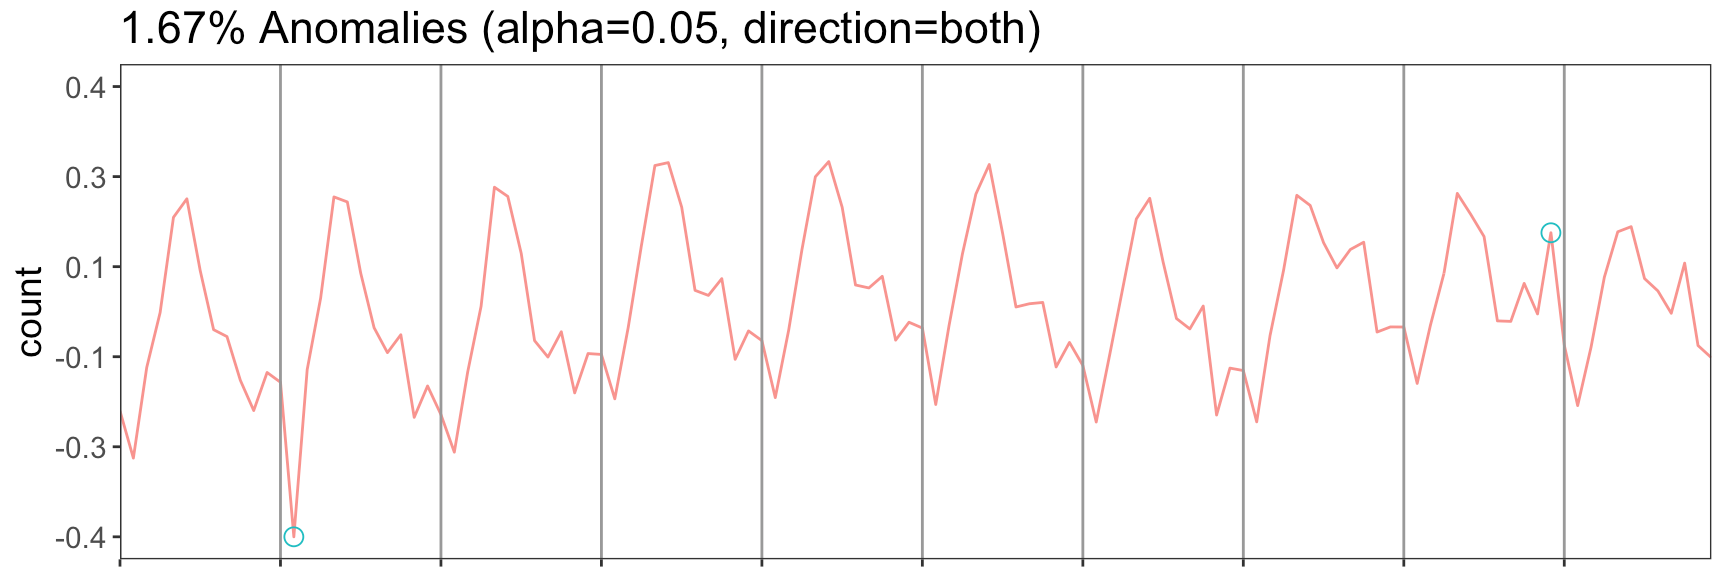
Seasonal-Hybrid ESD algorithm plot
AnomalyDetectionVec(x = msales$sales, period = 12,
                    direction = 'both', plot = T)