Isolation forest
Introduction to Anomaly Detection in R

Alastair Rushworth
Data Scientist
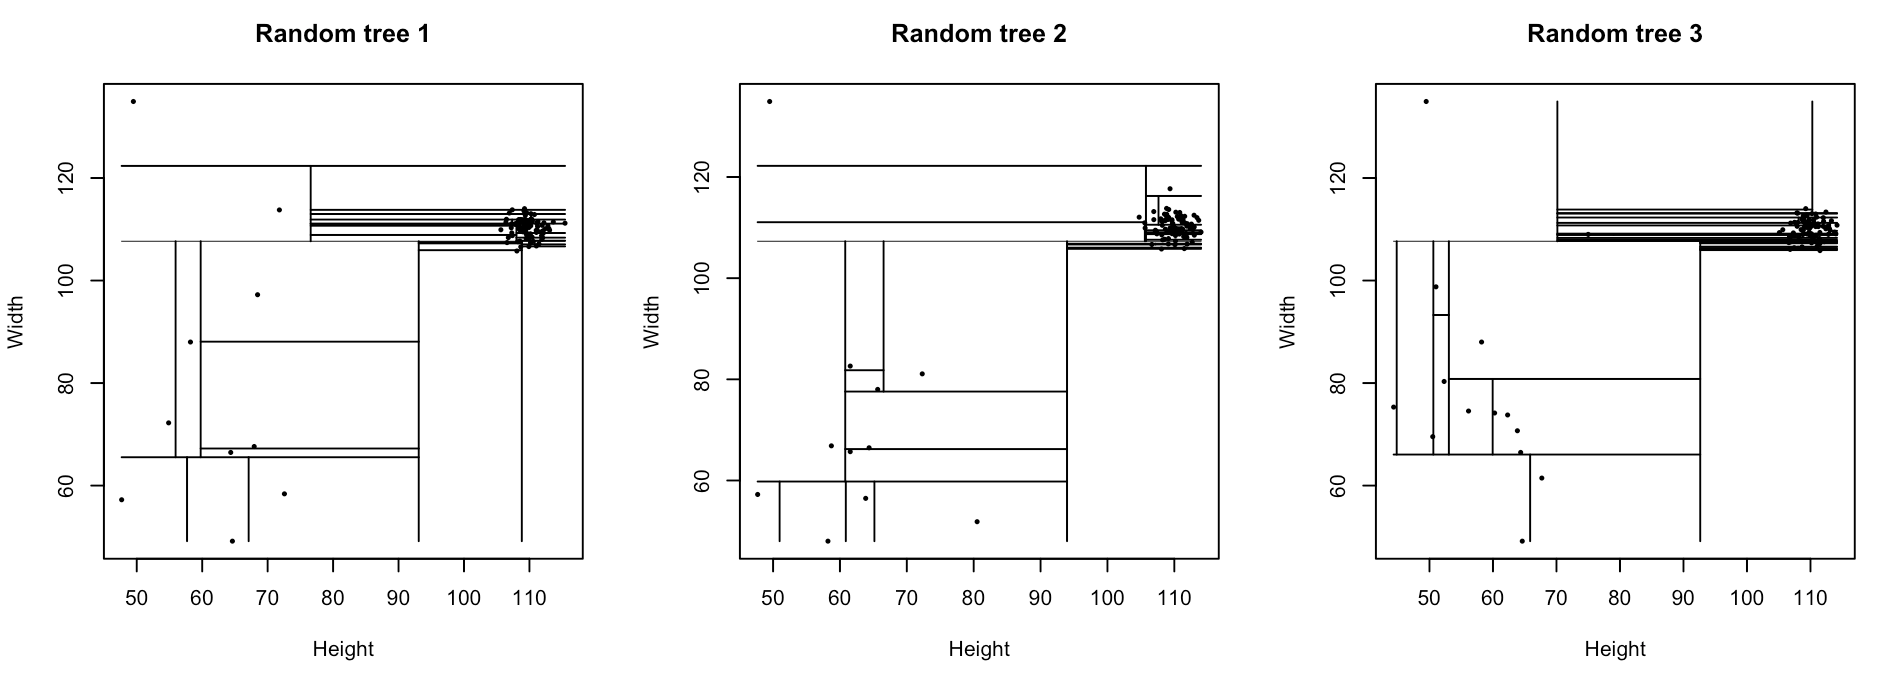
Sampling to build trees
furniture_tree <- iForest(data = furniture, nt = 1, phi = 100)
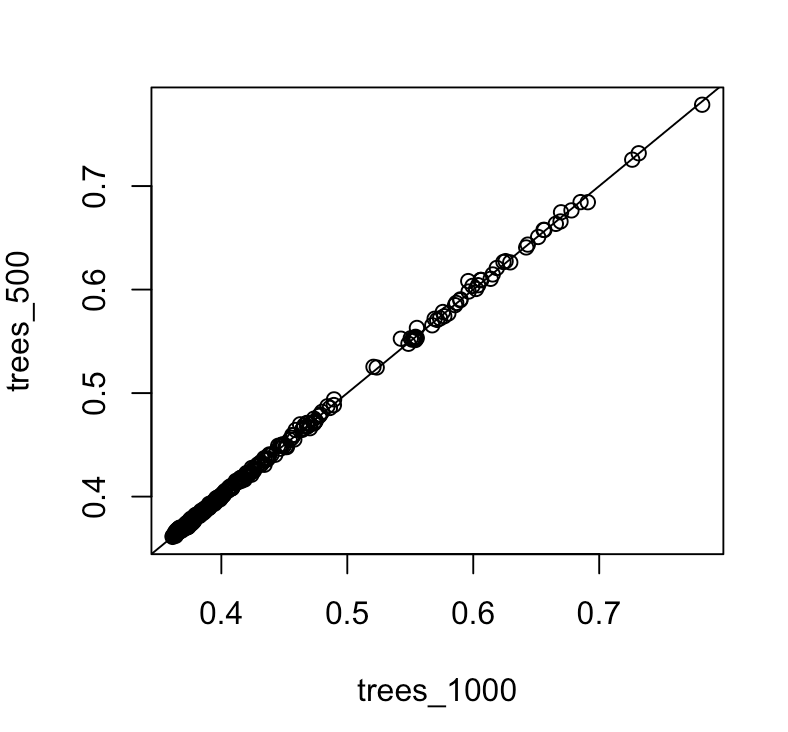
Score convergence
plot(trees_500 ~ trees_1000, data = furniture_scores)
abline(a = 0, b = 1)