Visualizing kNN distance score

Introduction to Anomaly Detection in R

Alastair Rushworth

Data Scientist

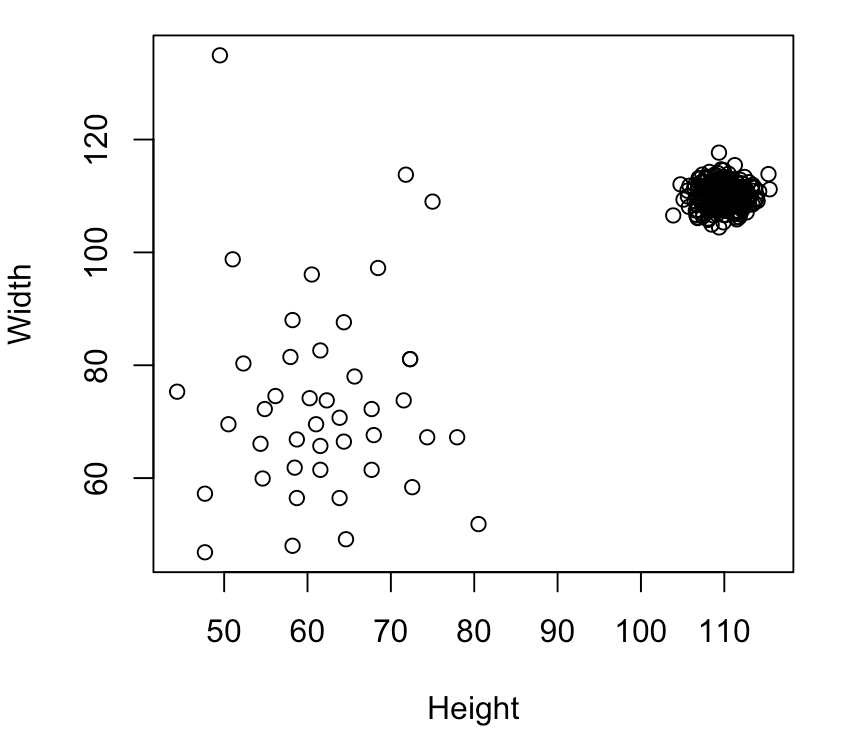
Standardizing feature scales

plot(Width ~ Height, data = furniture)

Introduction to Anomaly Detection in R

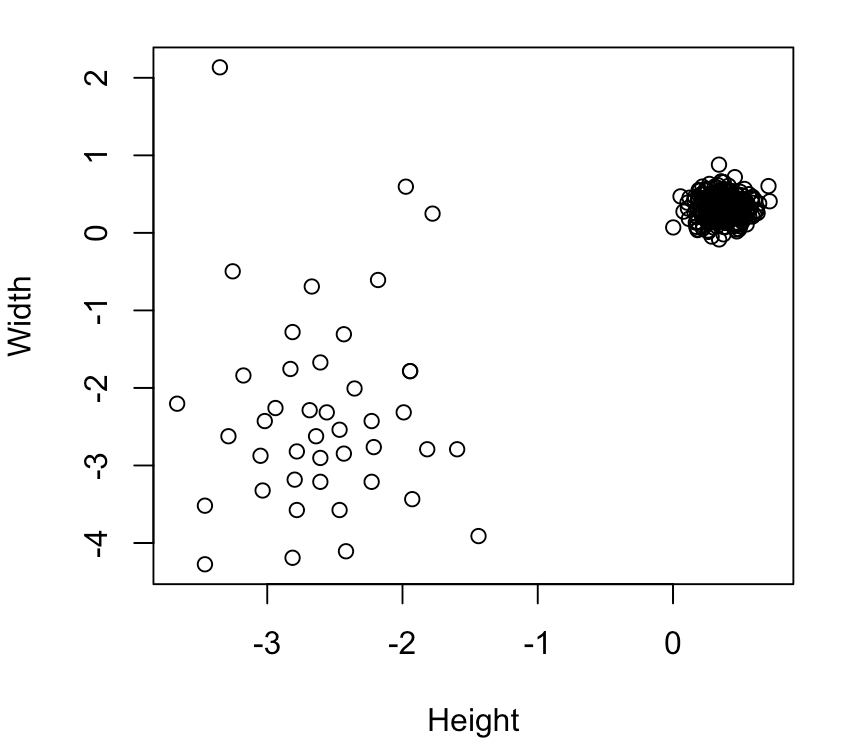
Standardizing features

furniture_scaled <- scale(furniture)

plot(Width ~ Height, data = furniture_scaled)

Introduction to Anomaly Detection in R

Create and append distance score

Distance matrix

furniture_scaled <- scale(furniture)
furniture_knn    <- get.knn(furniture_scaled, 5)

Calculate and append score

furniture$score  <- rowMeans(furniture_knn$nn.dist)

head(furniture, 4)
   Height   Width     score
1 58.7179 56.4663 0.4170000
2 54.6154 59.9279 0.3981695
3 58.7179 66.8510 0.2845042
4 63.8462 56.4663 0.4376807
Introduction to Anomaly Detection in R

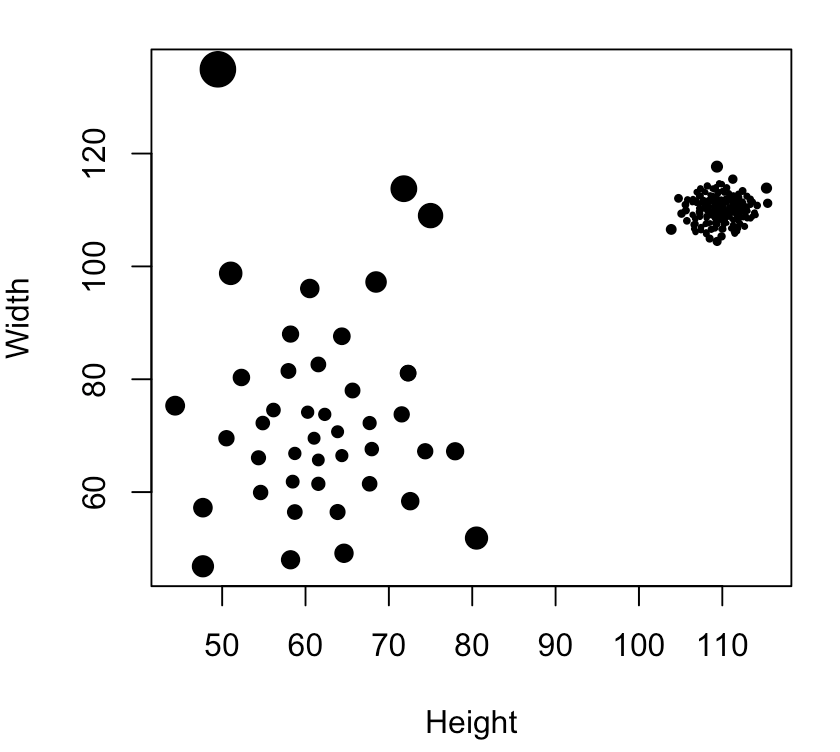
Visualizing distance score

plot(Width ~ Height, cex = sqrt(score), data = furniture, pch = 20)

Introduction to Anomaly Detection in R

Let's practice!

Introduction to Anomaly Detection in R

Preparing Video For Download...