Practicing imputing with different models
Dealing With Missing Data in R

Nicholas Tierney
Statistician
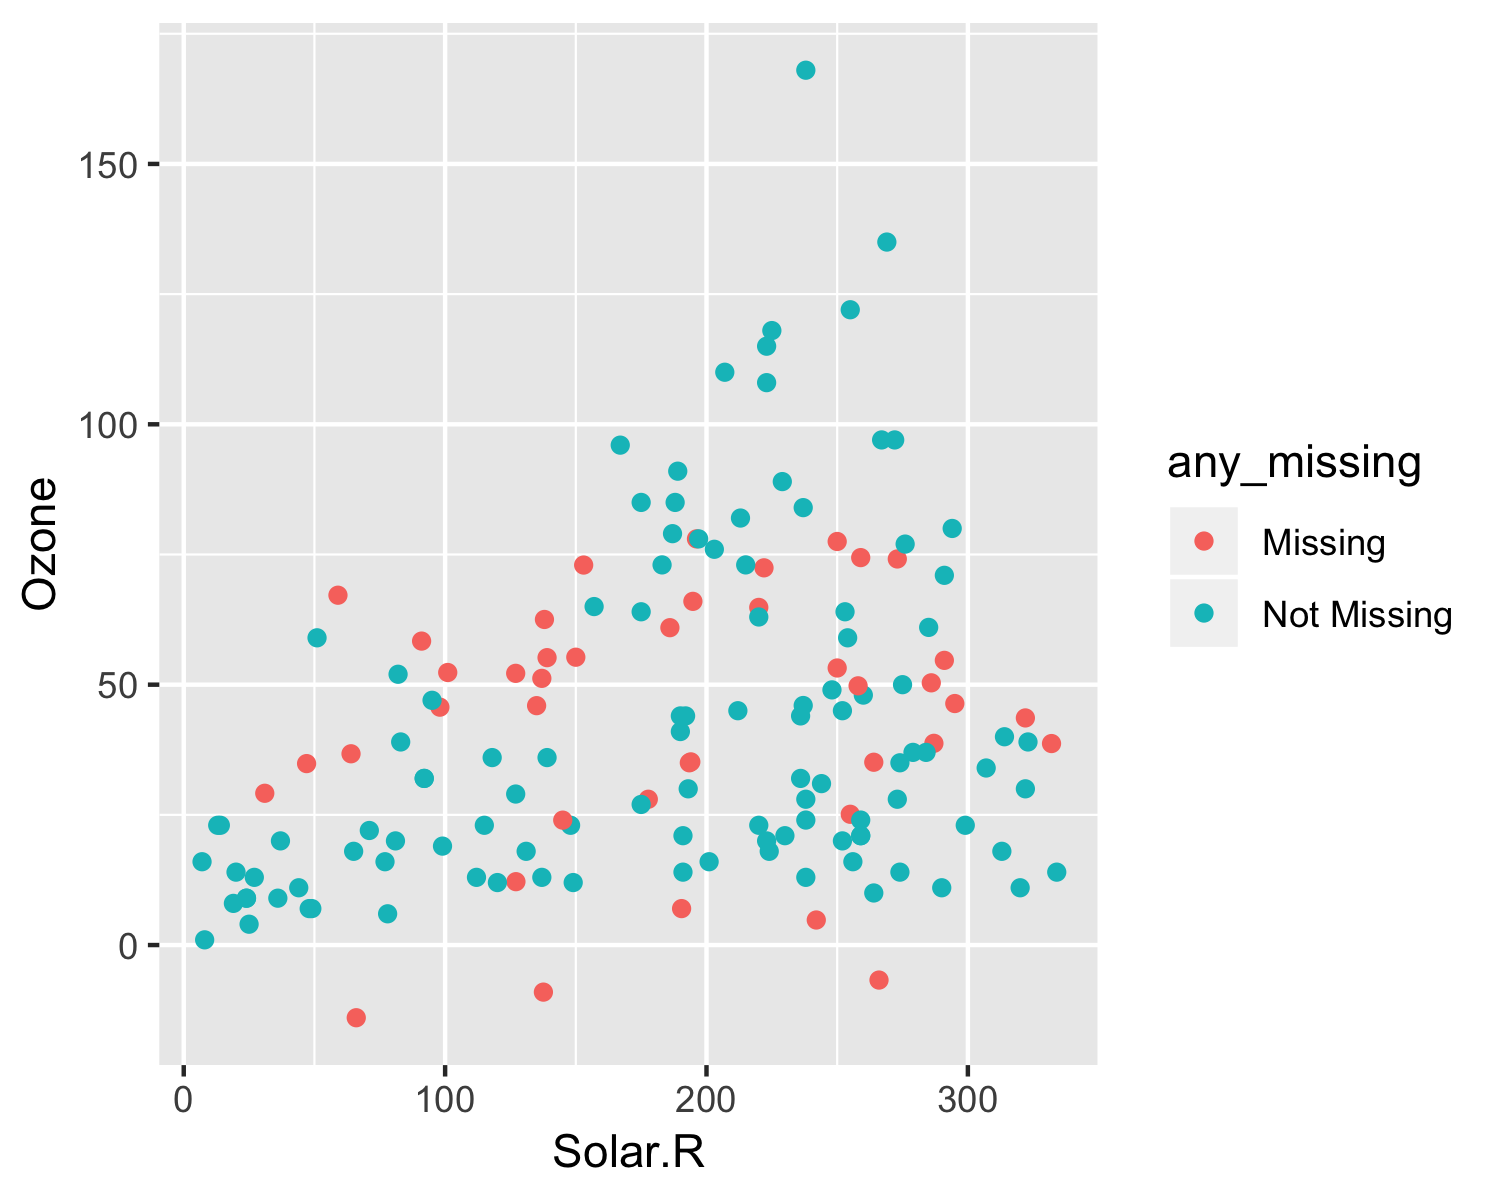
Tracking missing values
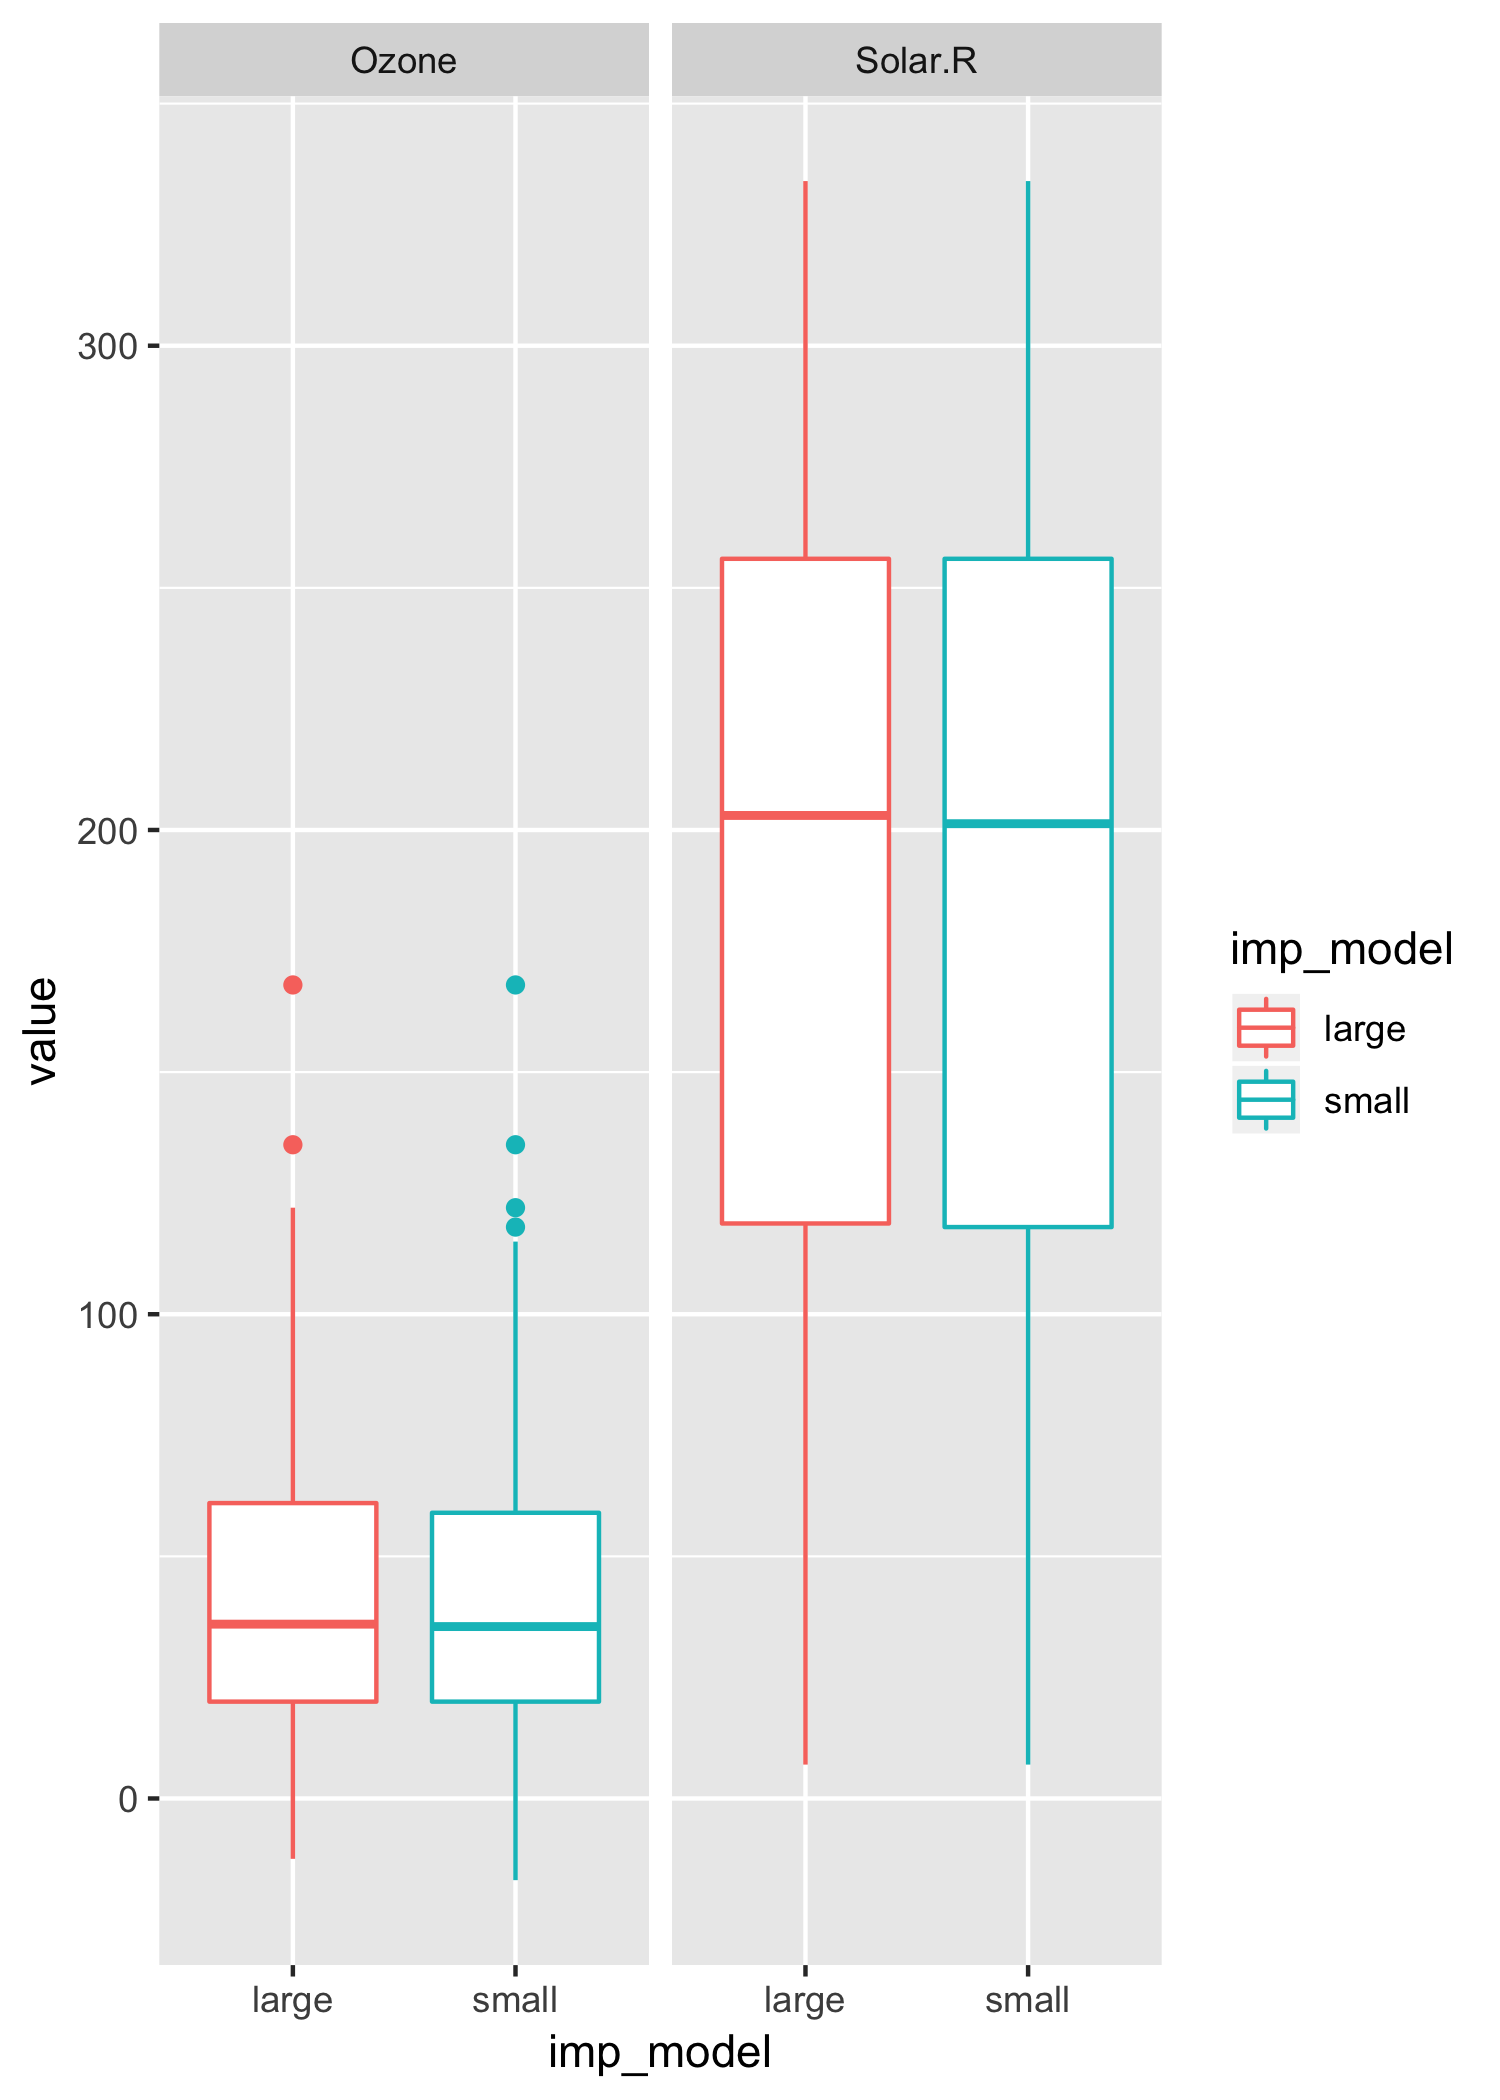
Evaluating imputations: exploring many imputations
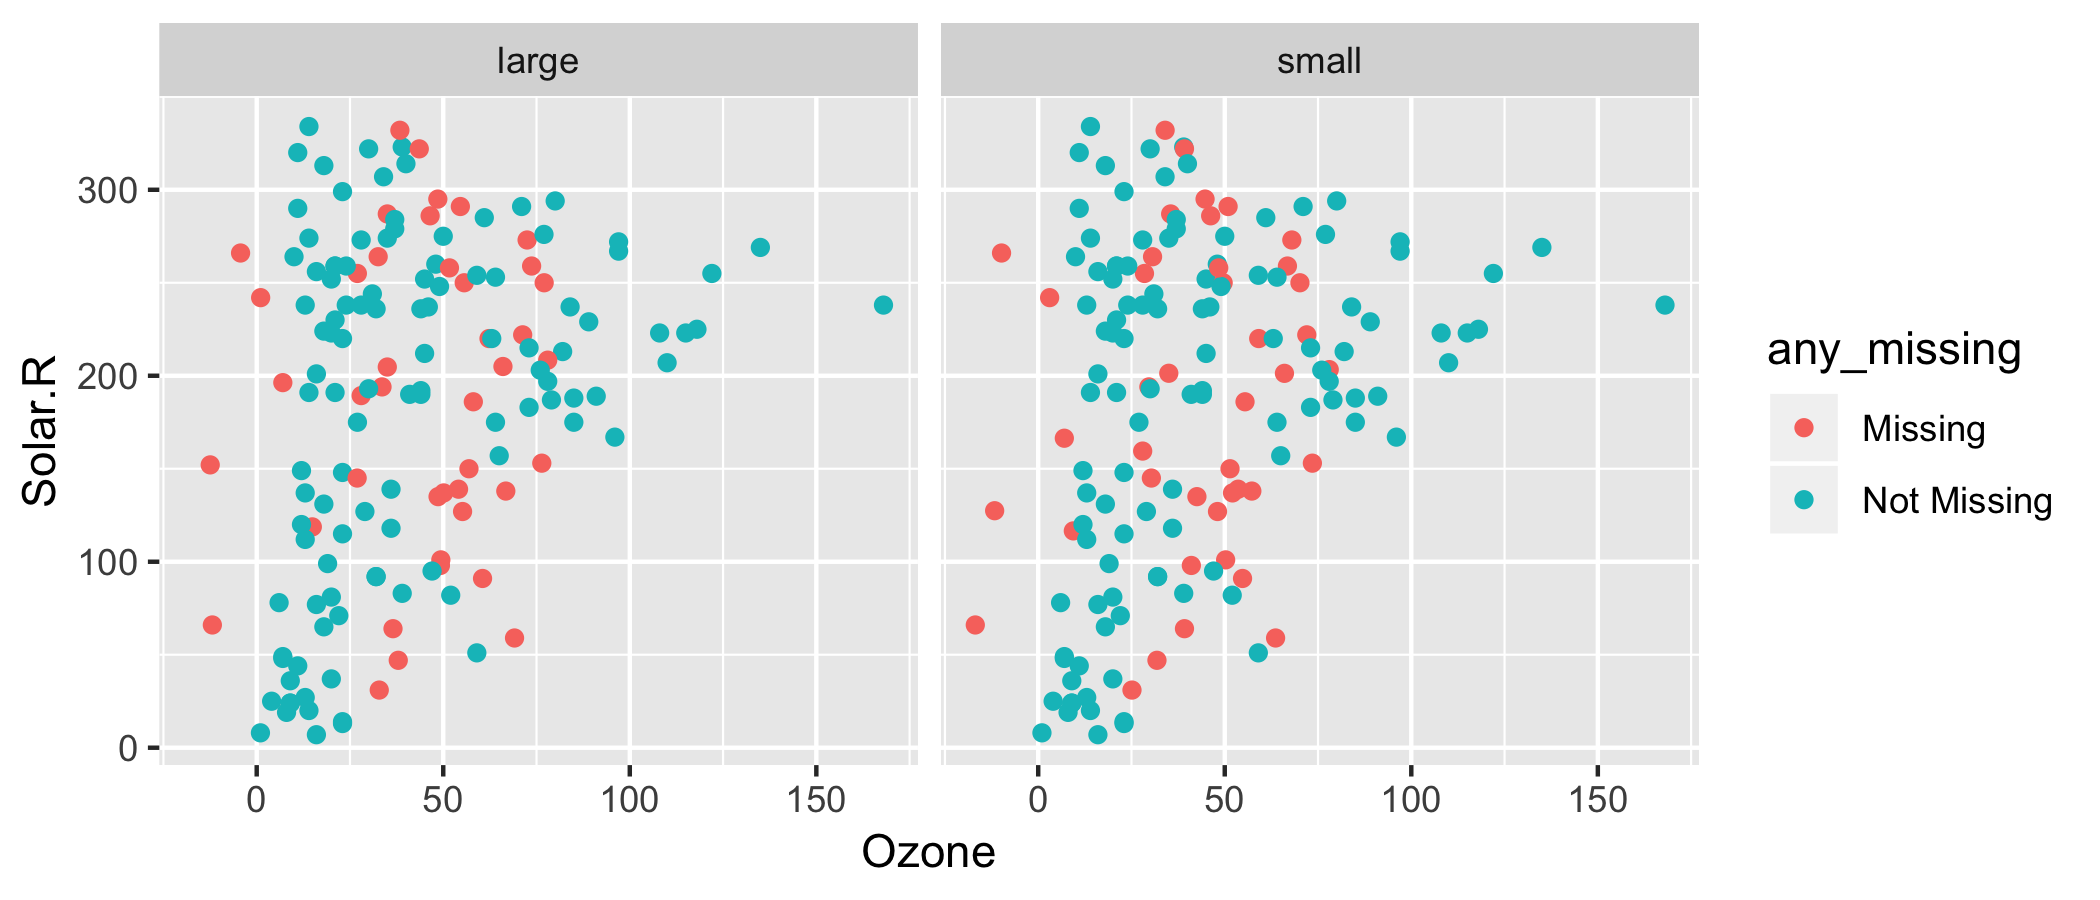
Explore imputations in multiple variables and models
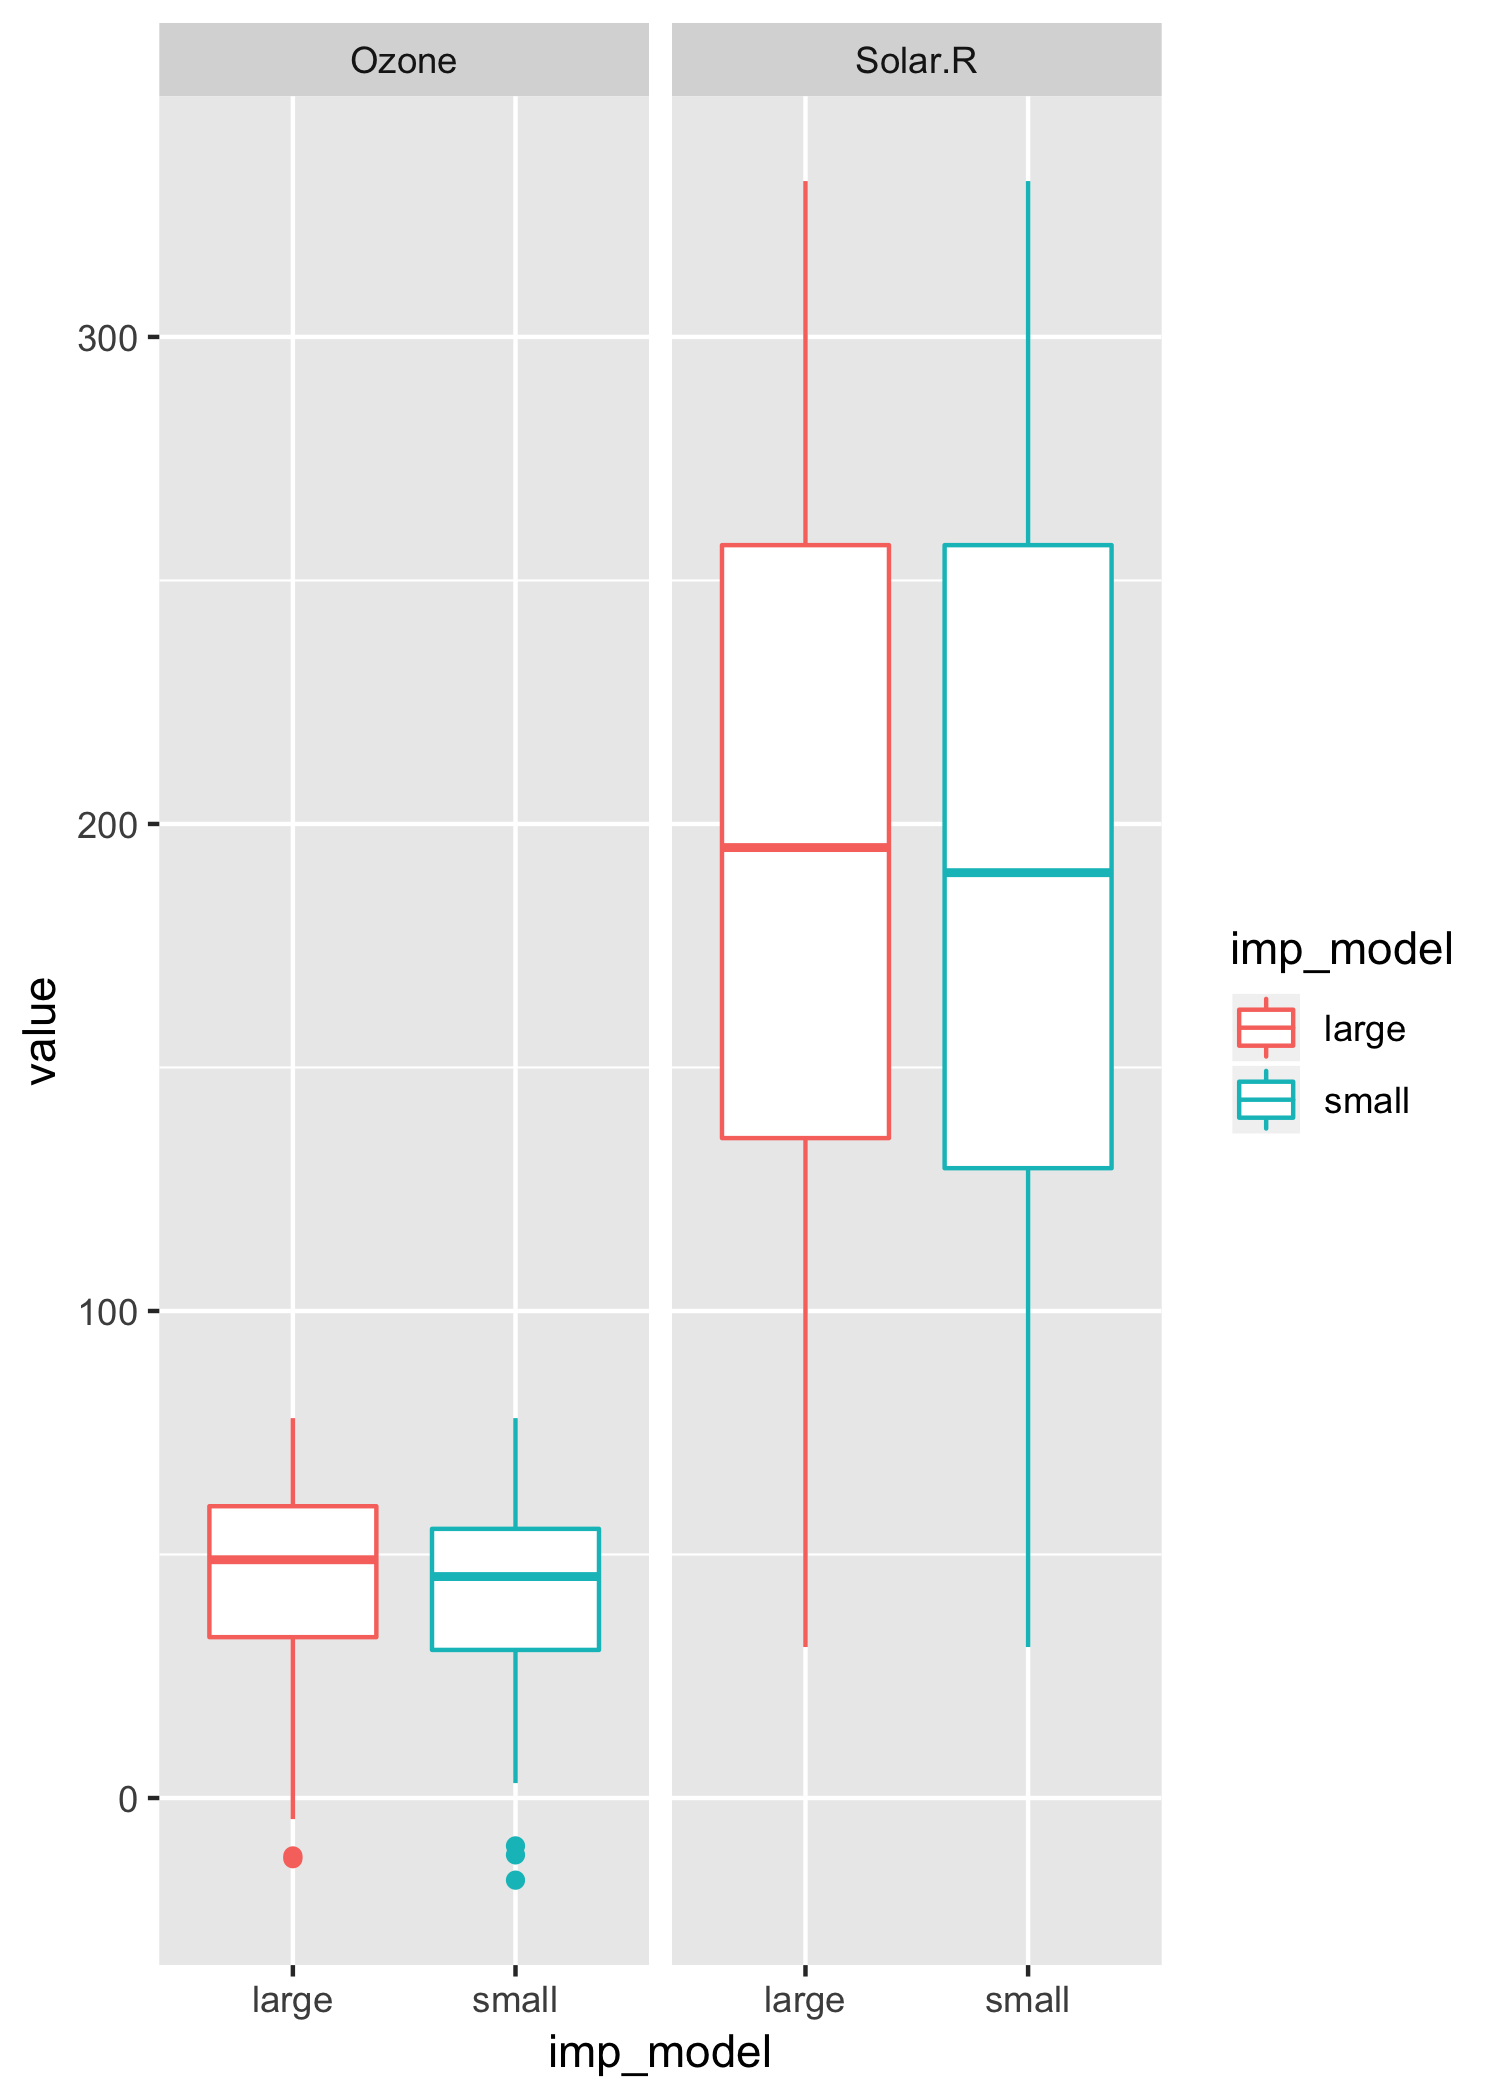
Explore imputations in multiple variables and models