Visualizing missingness across two variables
Dealing With Missing Data in R

Nicholas Tierney
Instructor
The problem of visualizing missing data in two dimensions
ggplot(airquality,
       aes(x = Ozone,
           y = Solar.R)) +
  geom_point()
Warning message:
Removed 42 rows containing
missing values (geom_point).

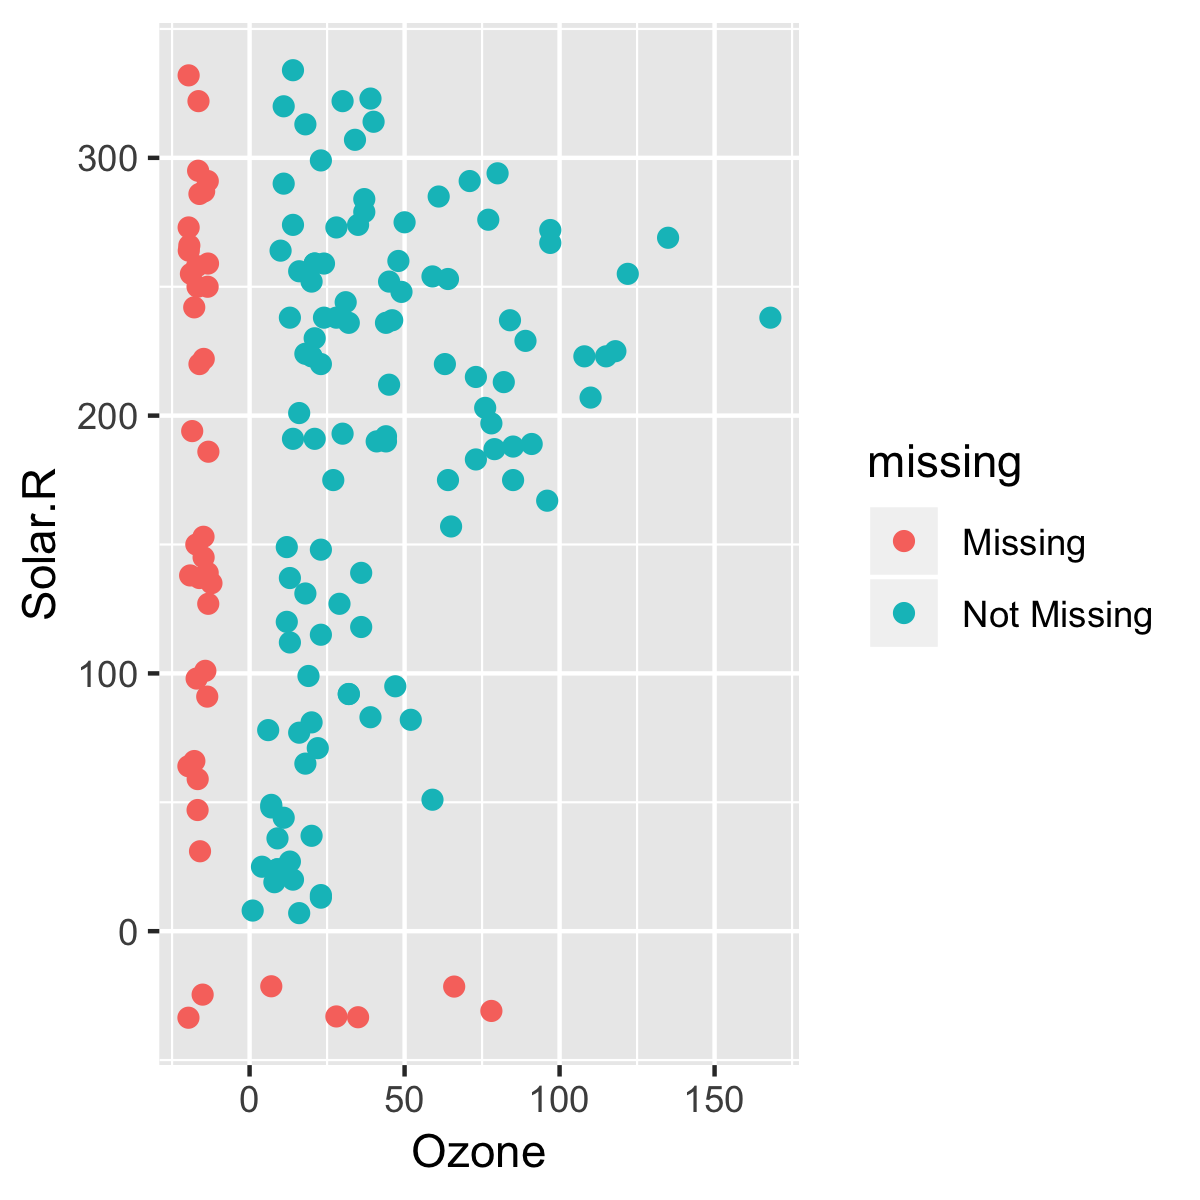
Introduction to geom_miss_point()
ggplot(airquality,
       aes(x = Ozone,
           y = Solar.R)) +
  geom_miss_point()

Aside: How geom_miss_point() works
| Ozone | Ozone_shift | Ozone_NA |
|---|---|---|
| 41 | 41.00000 | !NA |
| 36 | 36.00000 | !NA |
| 12 | 12.00000 | !NA |
| 18 | 18.00000 | !NA |
| NA | -19.72321 | NA |
| 28 | 28.00000 | !NA |
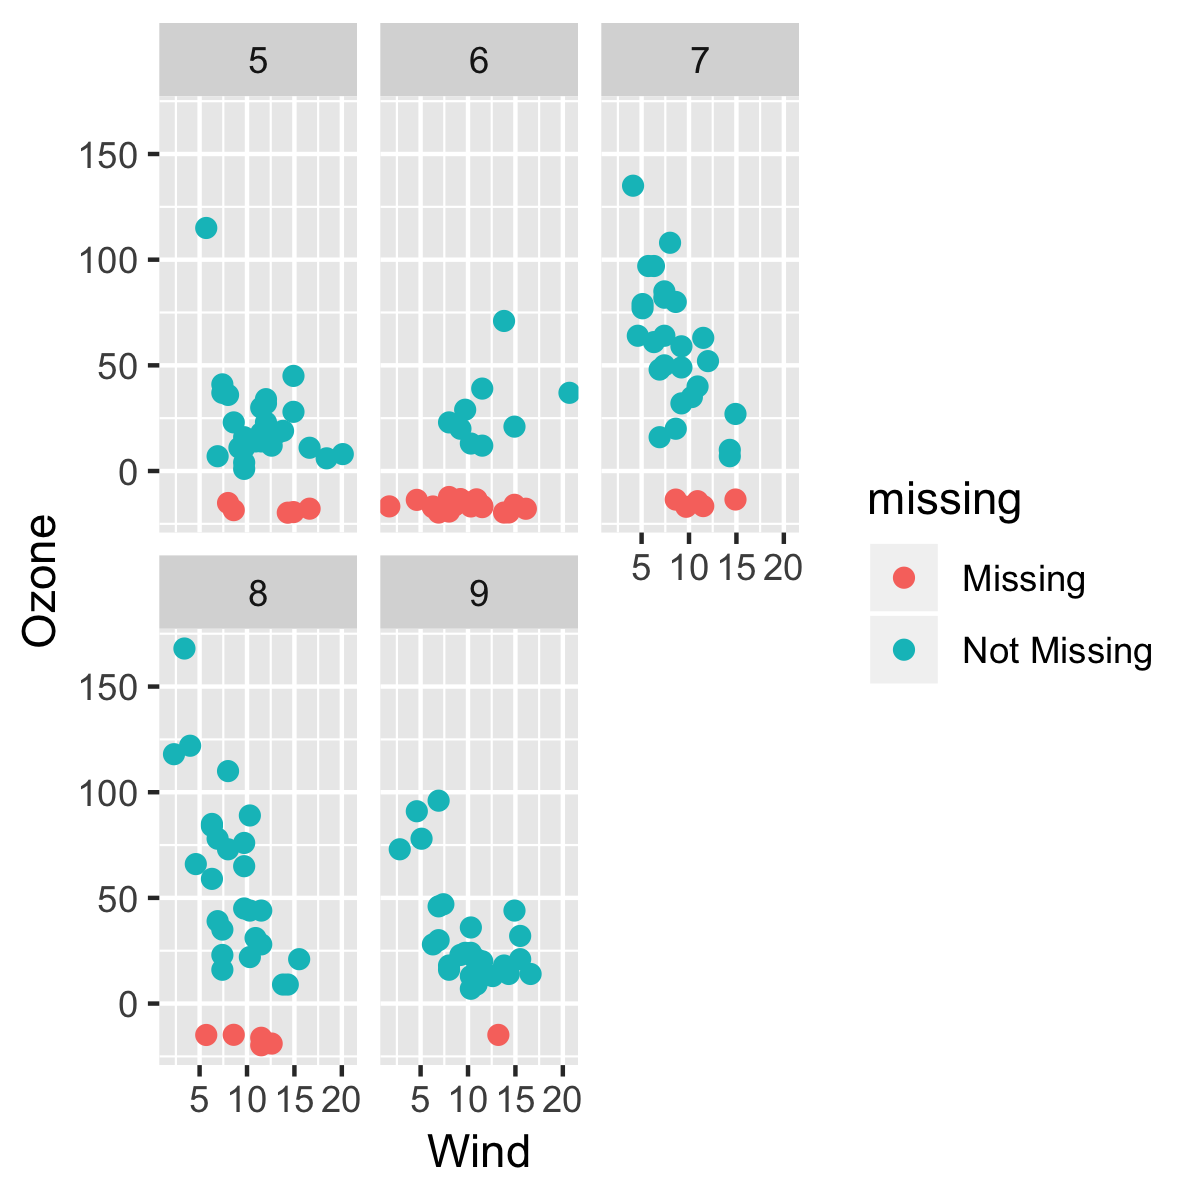
Exploring missingness using facets
ggplot(airquality,
       aes(x = Wind,
           y = Ozone)) +
  geom_miss_point() +
  facet_wrap(~ Month)

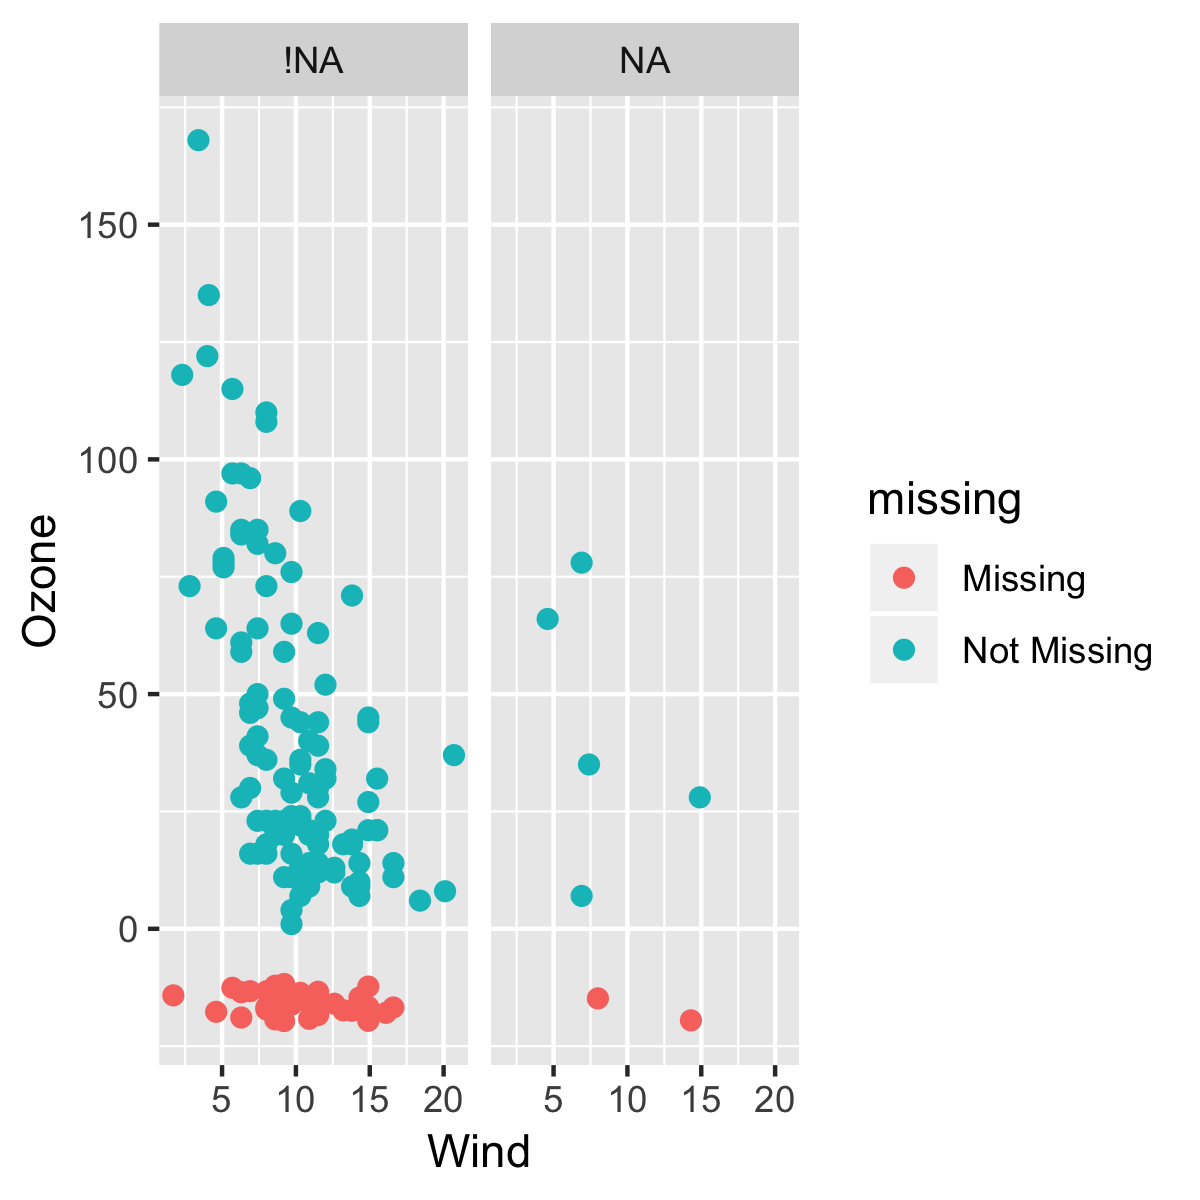
Exploring missingness using facets
airquality %>%
  bind_shadow() %>%
ggplot(aes(x = Wind,
           y = Ozone)) +
  geom_miss_point() +
  facet_wrap(~ Solar.R_NA)

Let's practice!
Dealing With Missing Data in R

