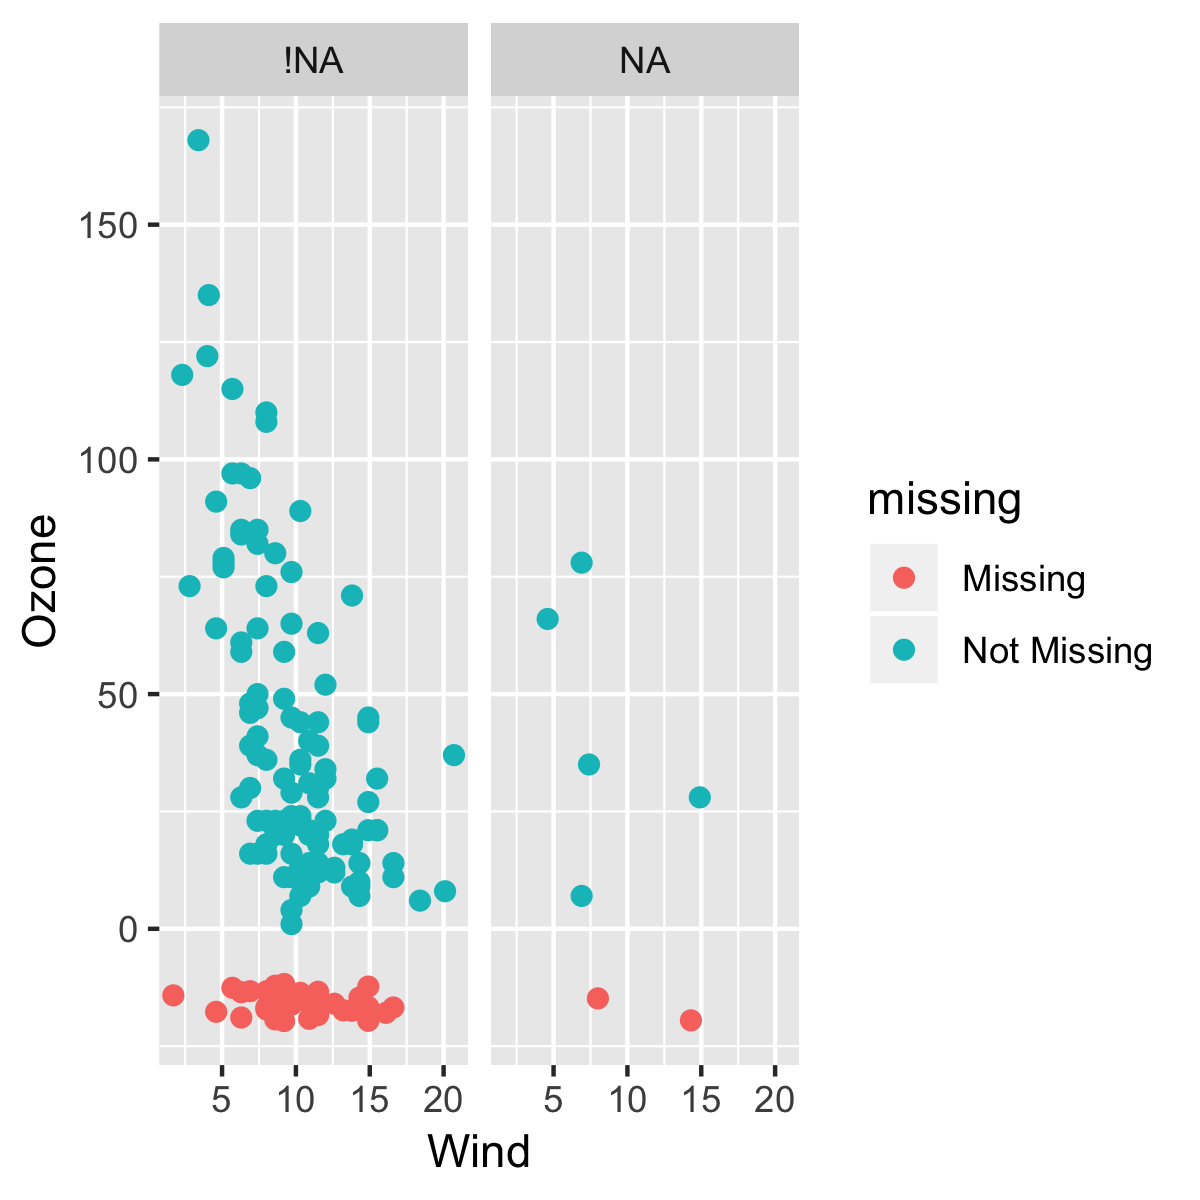
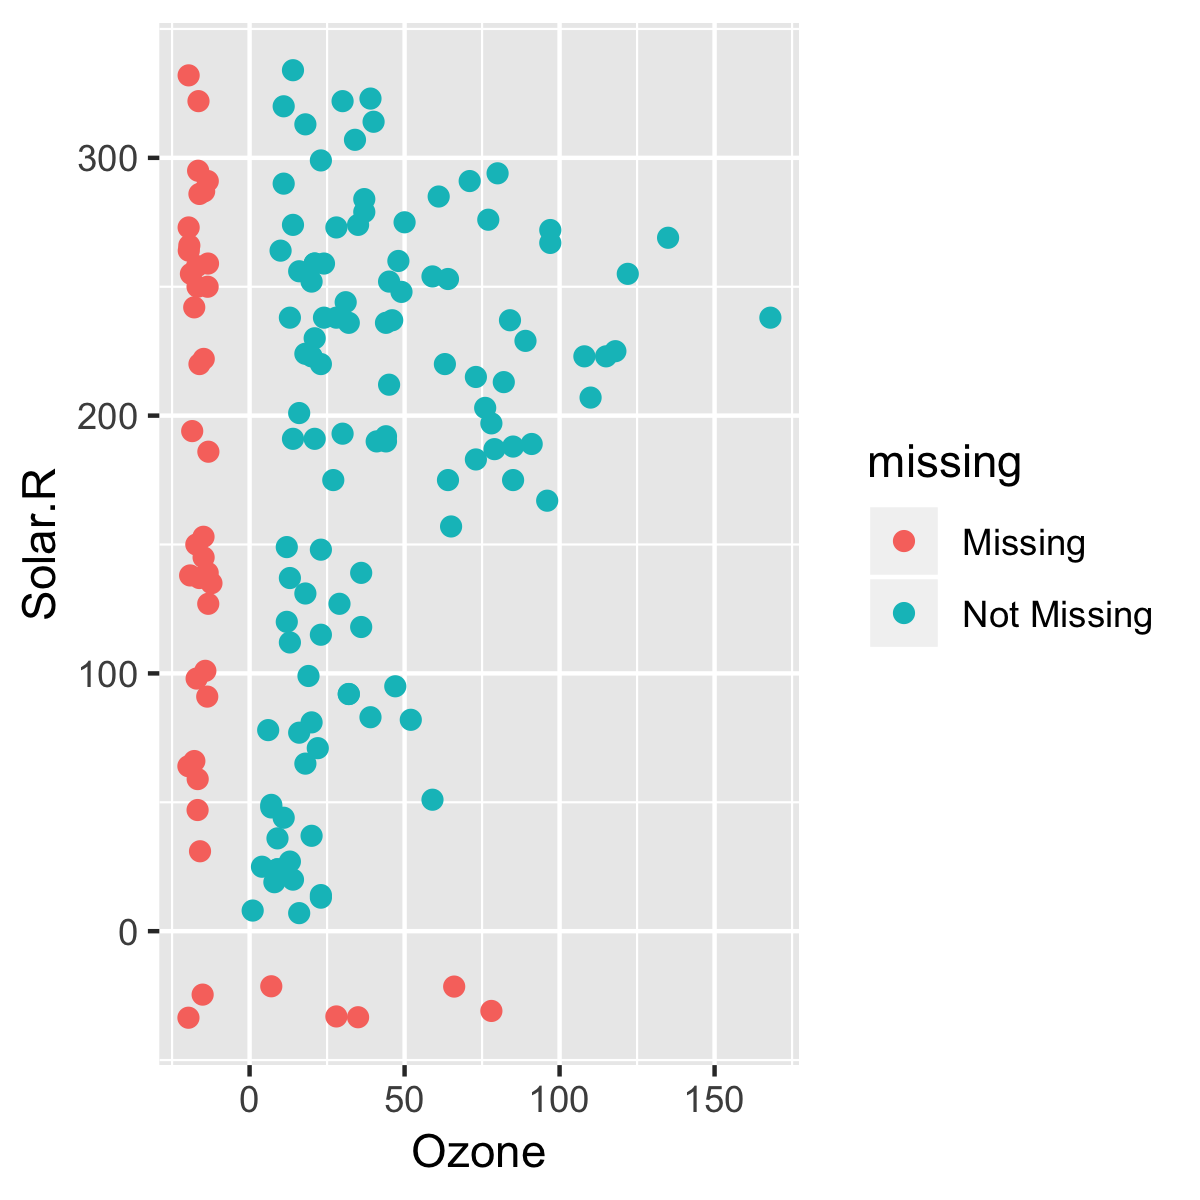
Visualizing missingness across two variables
Dealing With Missing Data in R

Nicholas Tierney
Instructor
The problem of visualizing missing data in two dimensions

Introduction to geom_miss_point()
Exploring missingness using facets
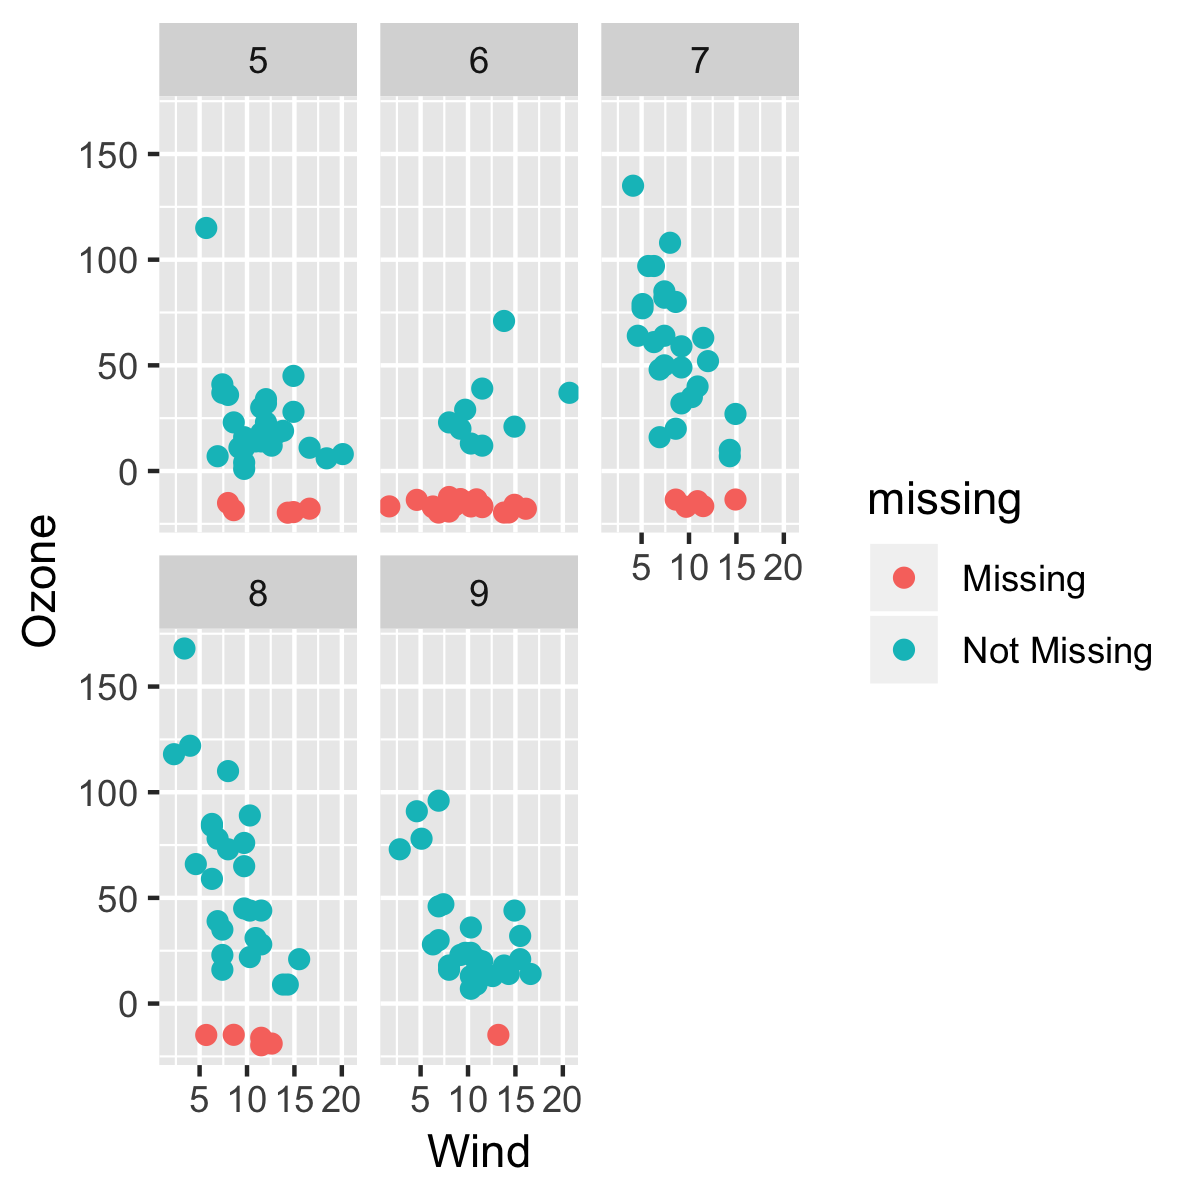
Exploring missingness using facets