Congratulations!
Dealing With Missing Data in R

Nicholas Tierney
Statistician
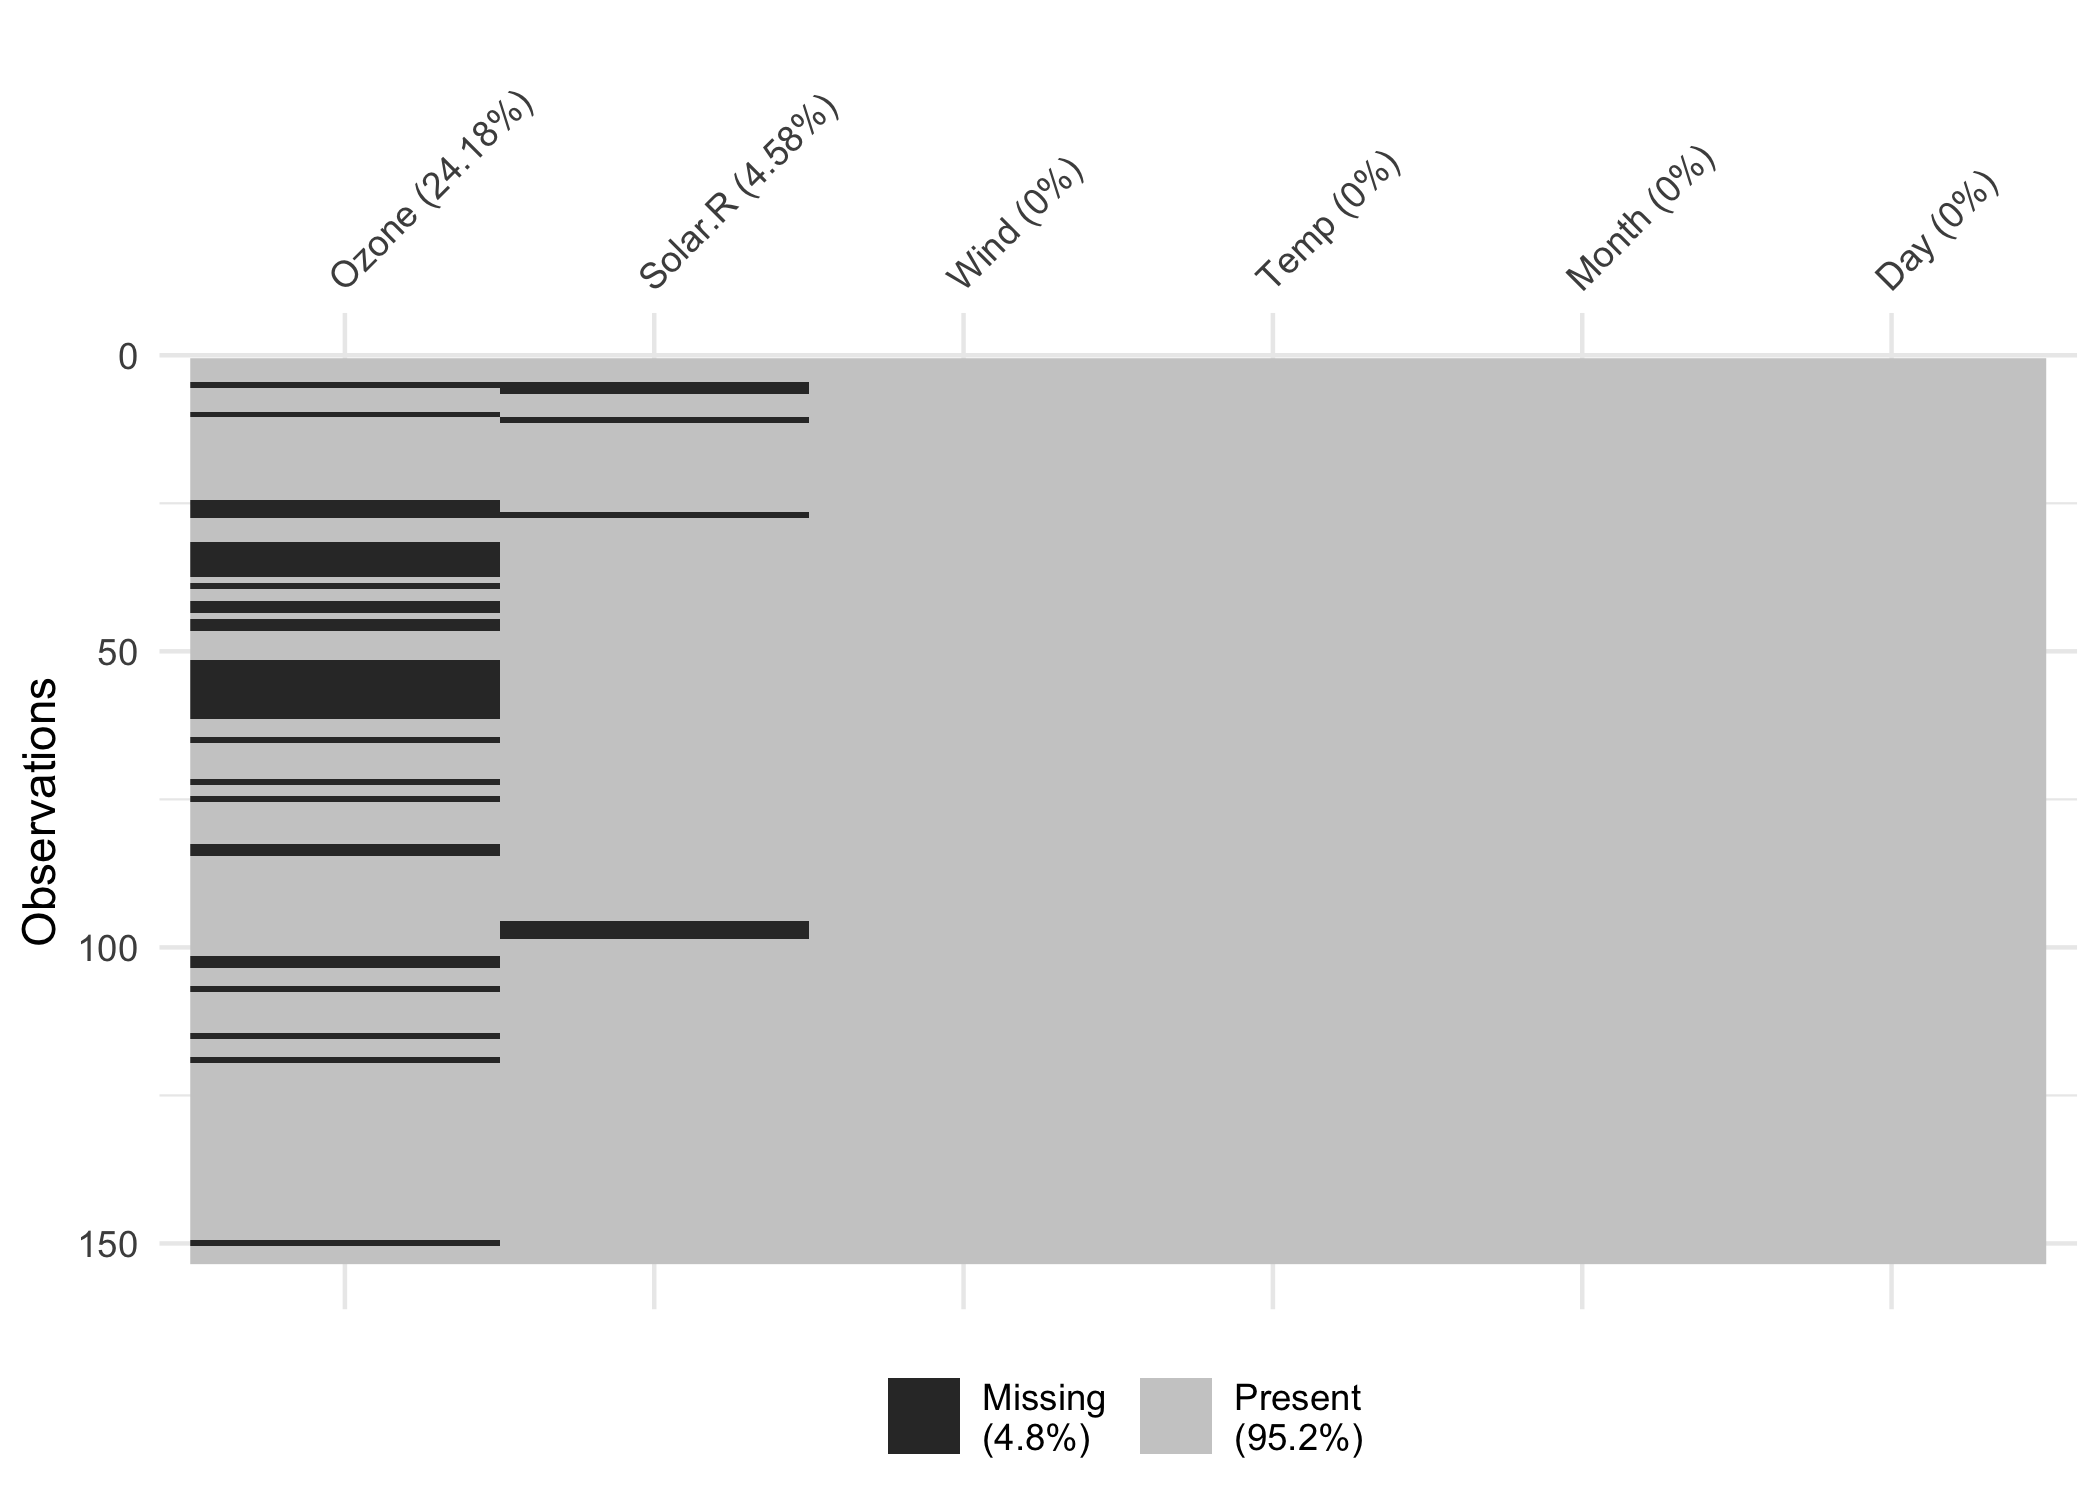
Chapter 1
vis_miss(airquality)
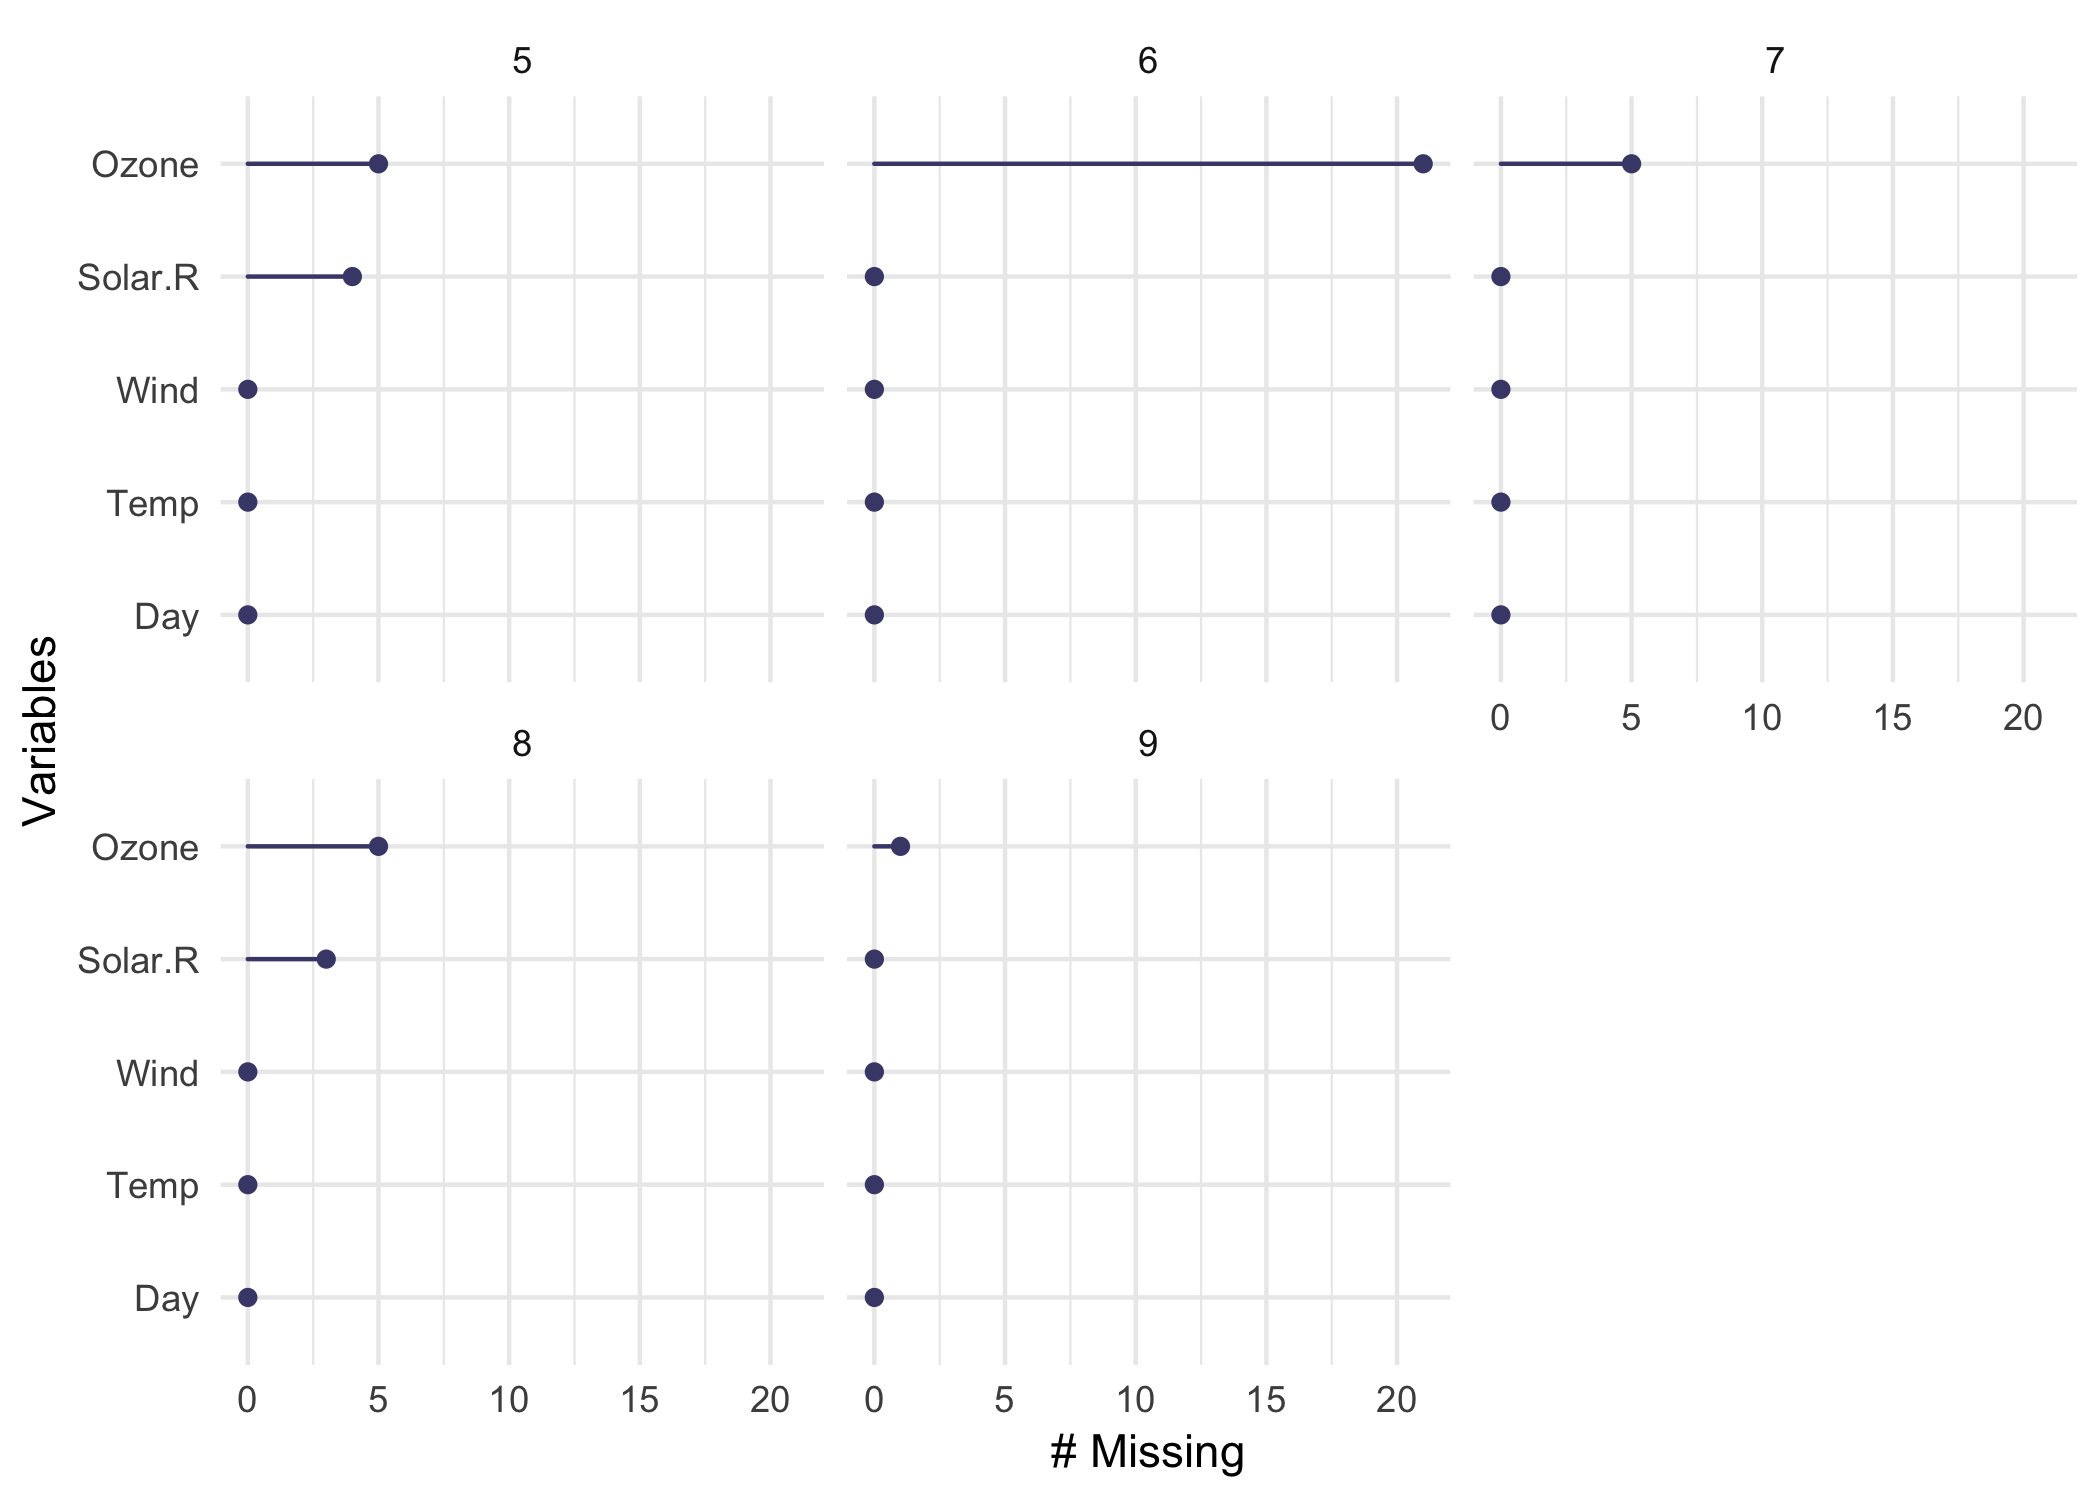
gg_miss_var(airquality, facet=Month)
Chapter 3
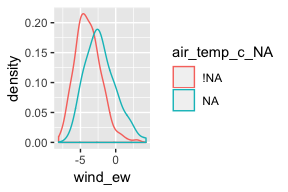
How values change with missingness.
nabular(oceanbuoys) %>%
  ggplot(aes(x = wind_ew,
             color = air_temp_c_NA)) +
  geom_density()
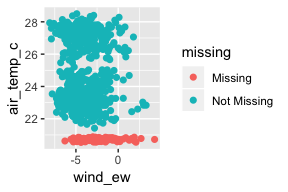
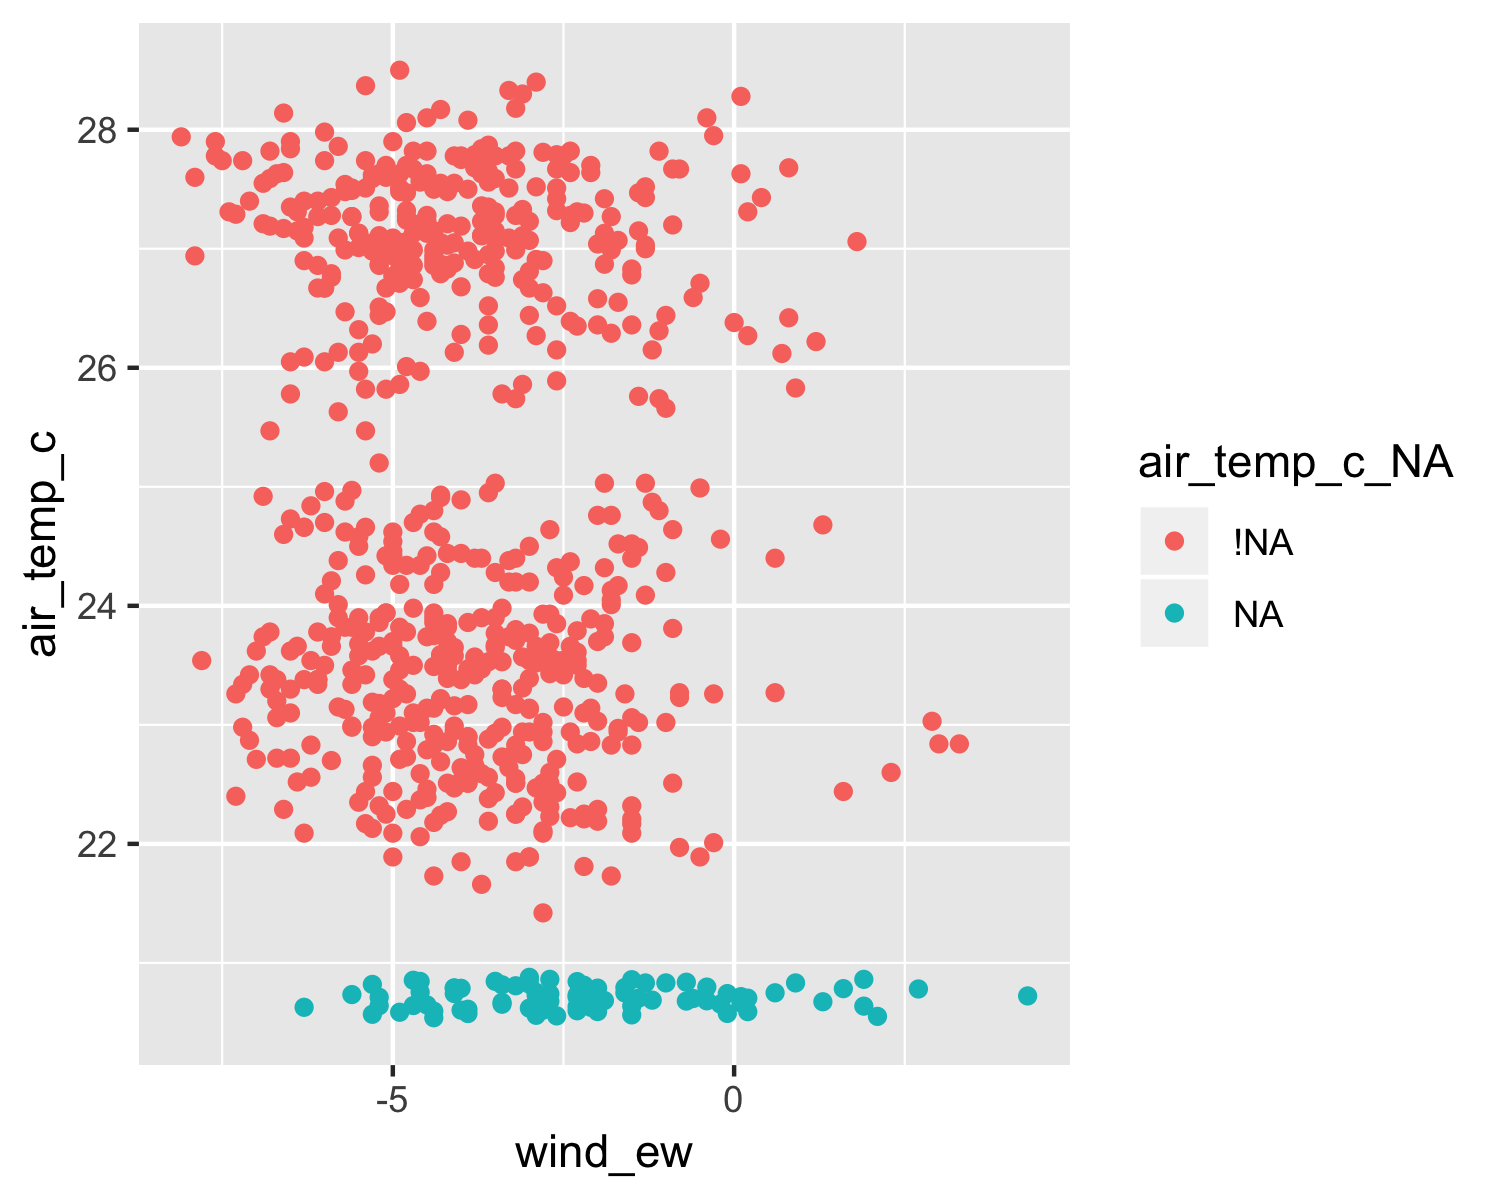
Visualize missings across 2 variables.
ggplot(oceanbuoys,
       aes(x = wind_ew,
           y = air_temp_c)) +
  geom_miss_point()
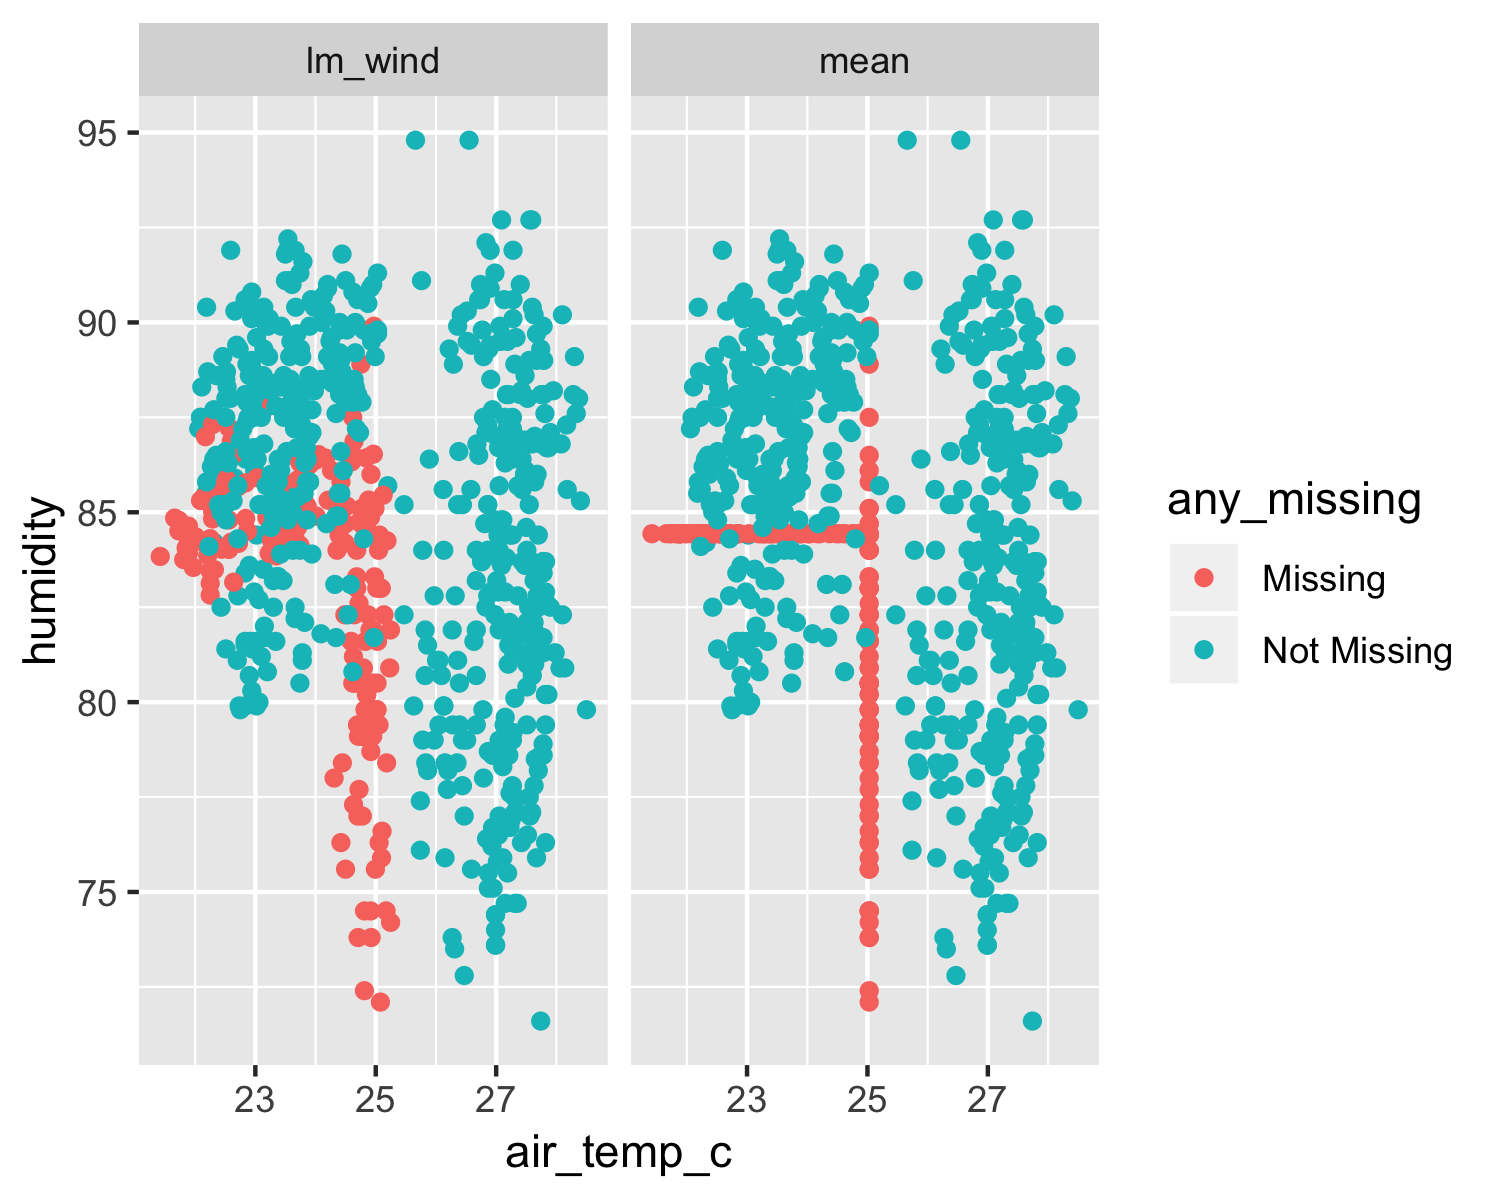
Chapter 4
Good and bad imputations
naniar::impute_mean_all()
simputation::impute_lm()
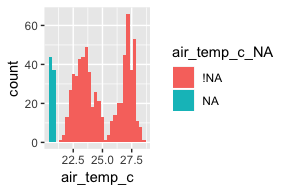
Compare imputed and original values
ggplot(ocean_imp_track,
       aes(x = air_temp_c,
           fill = air_temp_c_NA)) +
  geom_histogram()
Chapter 4
Using different imputation models