What makes a good imputation

Dealing With Missing Data in R

Nicholas Tierney

Statistician

Lesson overview

  • Understand good and bad imputations
  • Evaluate missing values:
    • Mean, Scale, Spread
  • Using visualizations
    • Box plots
    • Scatter plots
    • Histograms
    • Many variables
Dealing With Missing Data in R

Understanding the good by understanding the bad

# A tibble: 6 x 1
       x
   <dbl>
 1     1
 2     4
 3     9
 4    16
 5    NA
 6    36
mean(df$x, na.rm = TRUE)
# A tibble: 6 x 1
       x
   <dbl>
 1   1  
 2   4  
 3   9  
 4  16  
 5  13.2
 6  36
13.2
Dealing With Missing Data in R

Demonstrating mean imputation

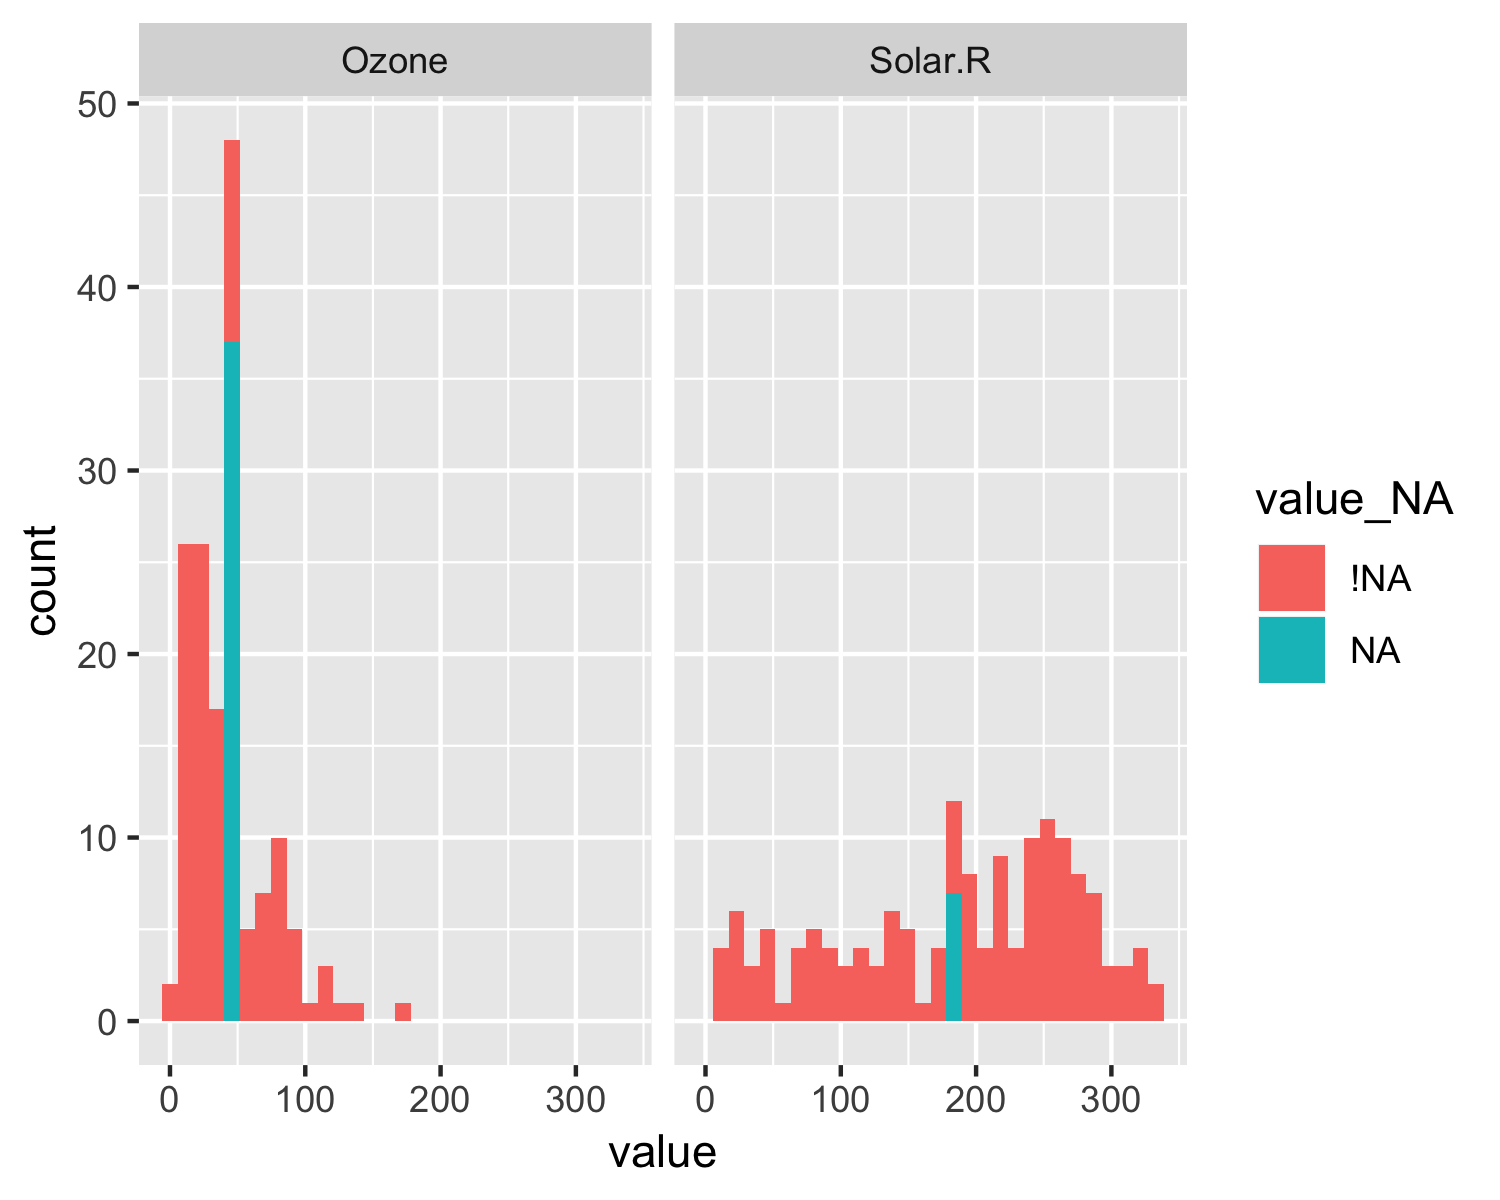
Data with missing values

Data with mean imputations

Dealing With Missing Data in R

Explore bad imputations: The mean

  • impute_mean(data$variable)
  • impute_mean_if(data, is.numeric)
  • impute_mean_at(data, vars(variable1, variable2))
  • impute_mean_all(data)
Dealing With Missing Data in R

Tracking missing values

aq_impute_mean <- airquality %>%
  bind_shadow(only_miss = TRUE) %>%
  impute_mean_all() %>%
  add_label_shadow()
aq_impute_mean
# A tibble: 153 x 9
   Ozone Solar.R  Wind  Temp Month   Day Ozone_NA Solar.R_NA any_missing
   <dbl>   <dbl> <dbl> <dbl> <dbl> <dbl> <fct>    <fct>      <chr>      
 1  41      190    7.4    67     5     1 !NA      !NA        Not Missing
 2  36      118    8      72     5     2 !NA      !NA        Not Missing
 3  12      149   12.6    74     5     3 !NA      !NA        Not Missing
 4  18      313   11.5    62     5     4 !NA      !NA        Not Missing
 5  42.1    186.  14.3    56     5     5 NA       NA         Missing    
 6  28      186.  14.9    66     5     6 !NA      NA         Missing    
Dealing With Missing Data in R

Exploring imputations using a box plot

When evaluating imputations, explore changes / similarities in

  • The mean/median (boxplot)
  • The spread
  • The scale
Dealing With Missing Data in R

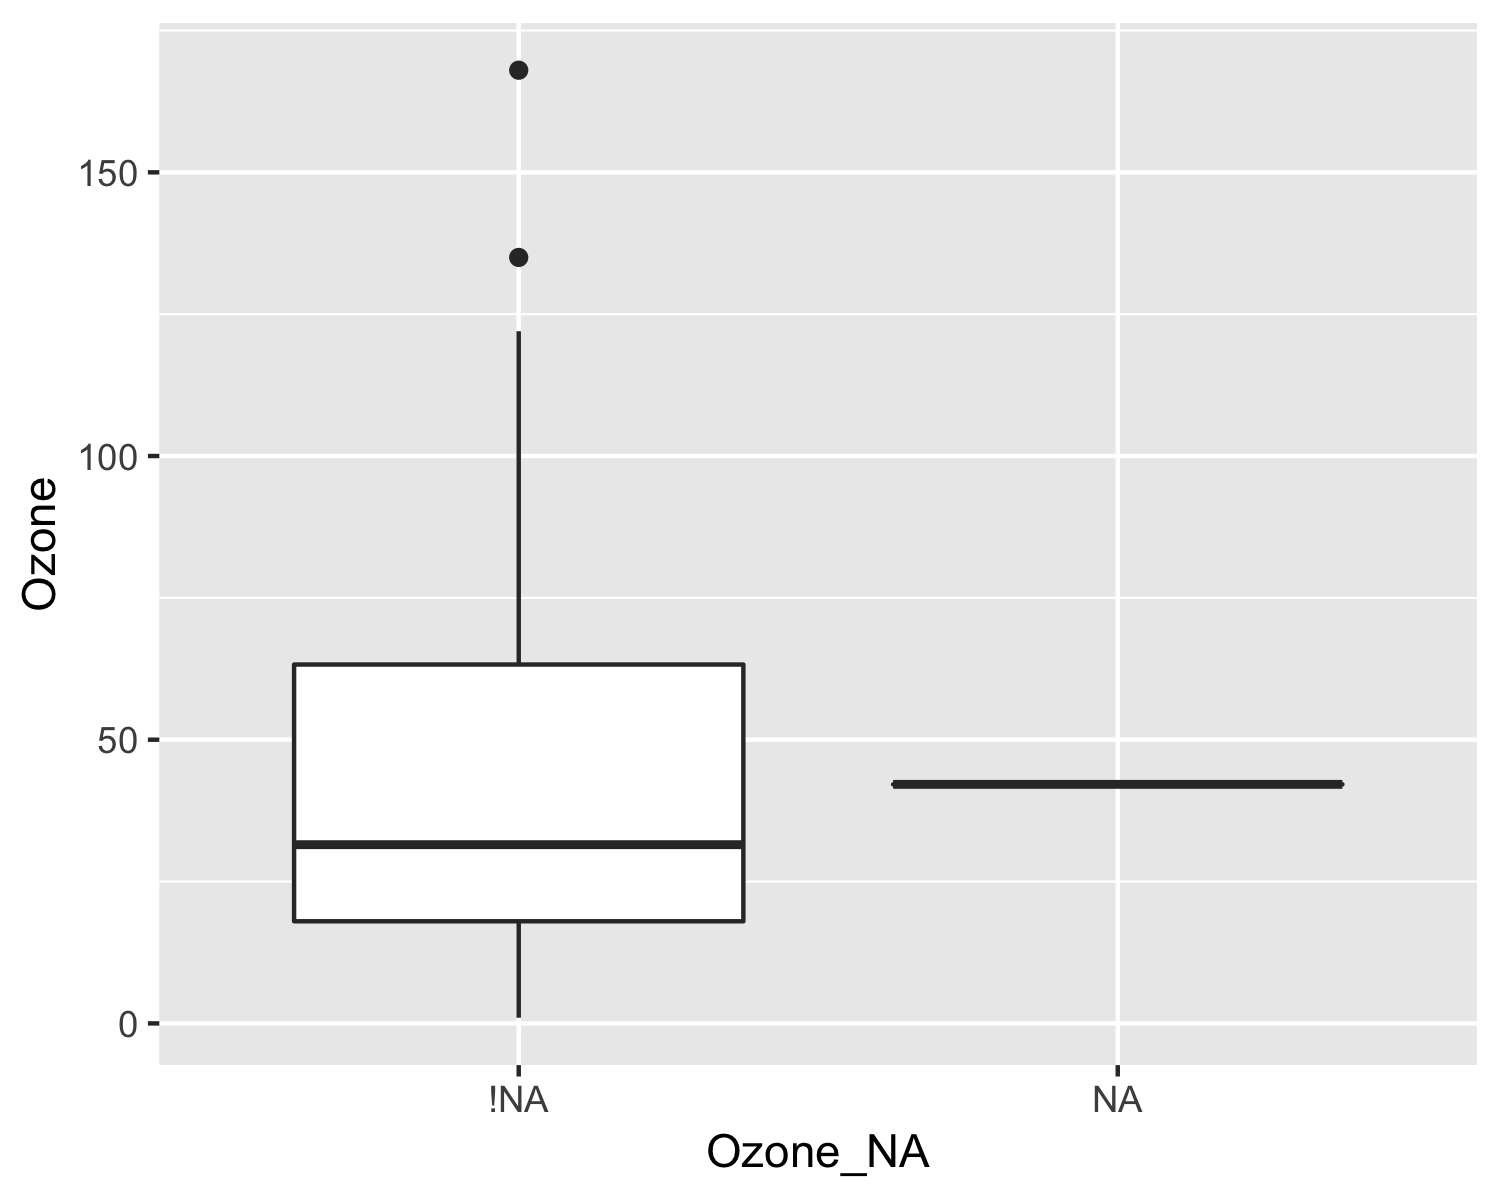
Visualizing imputations using the box plot

ggplot(aq_impute_mean,
       aes(x = Ozone_NA,
           y = Ozone)) +
  geom_boxplot()

Dealing With Missing Data in R

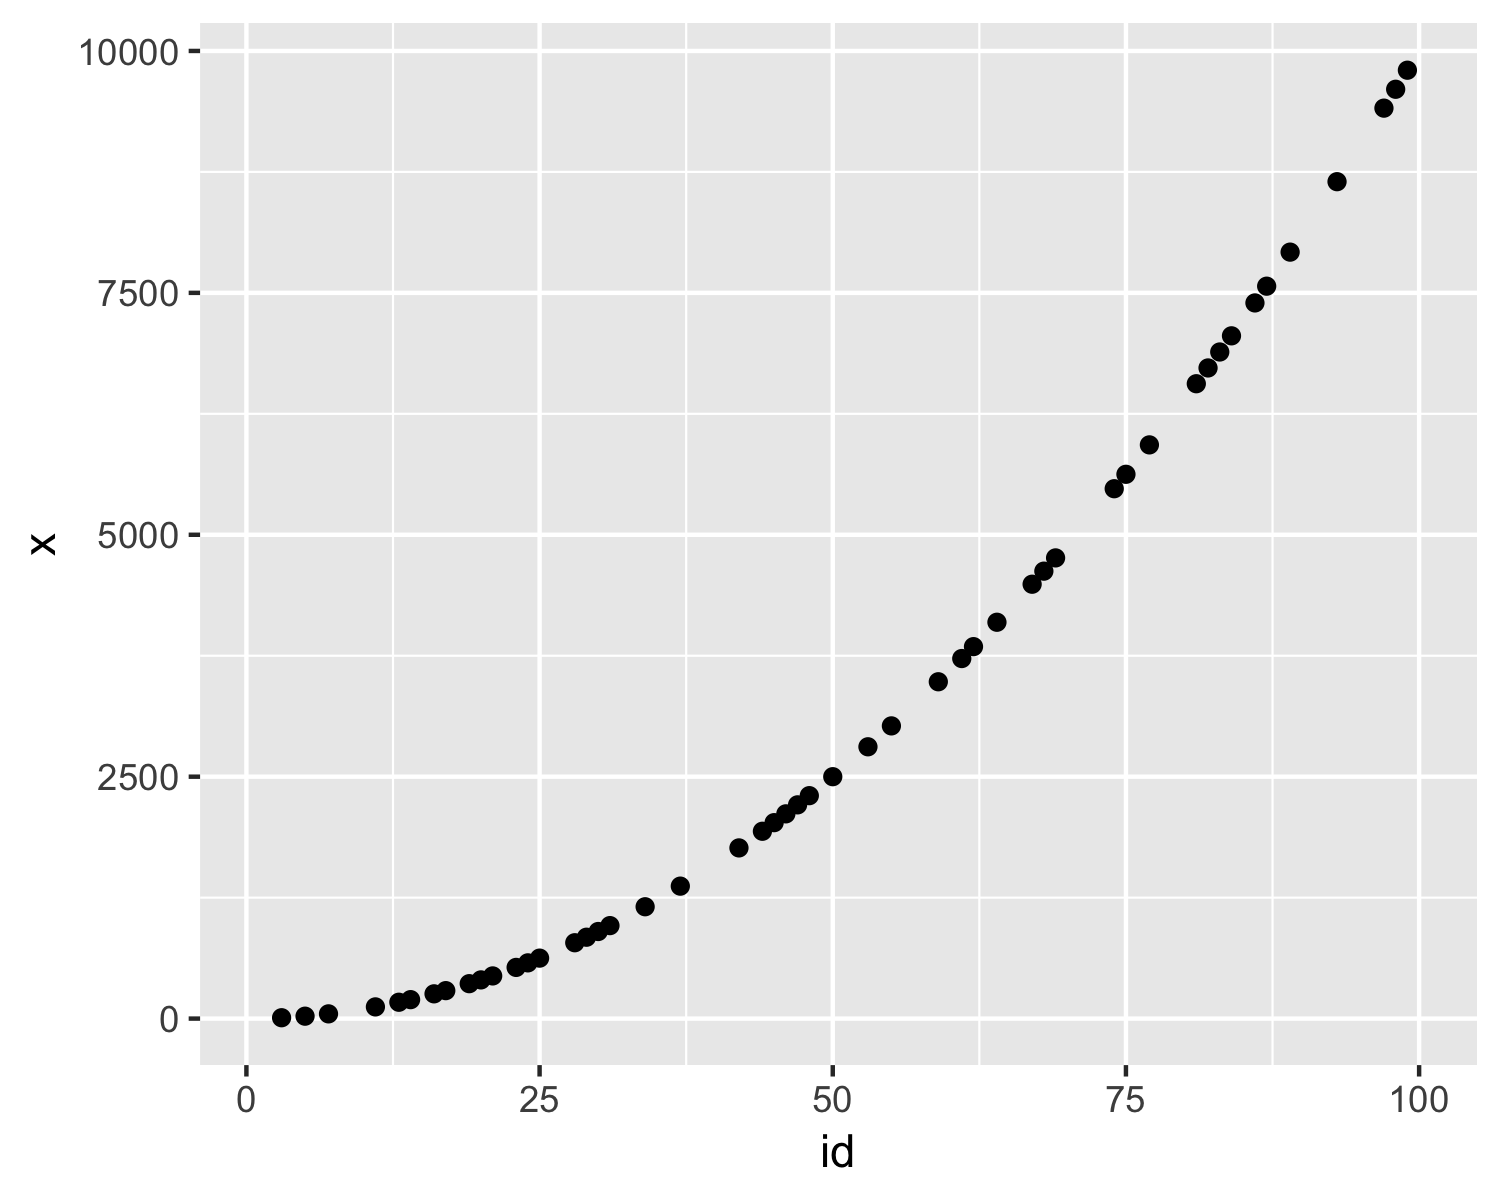
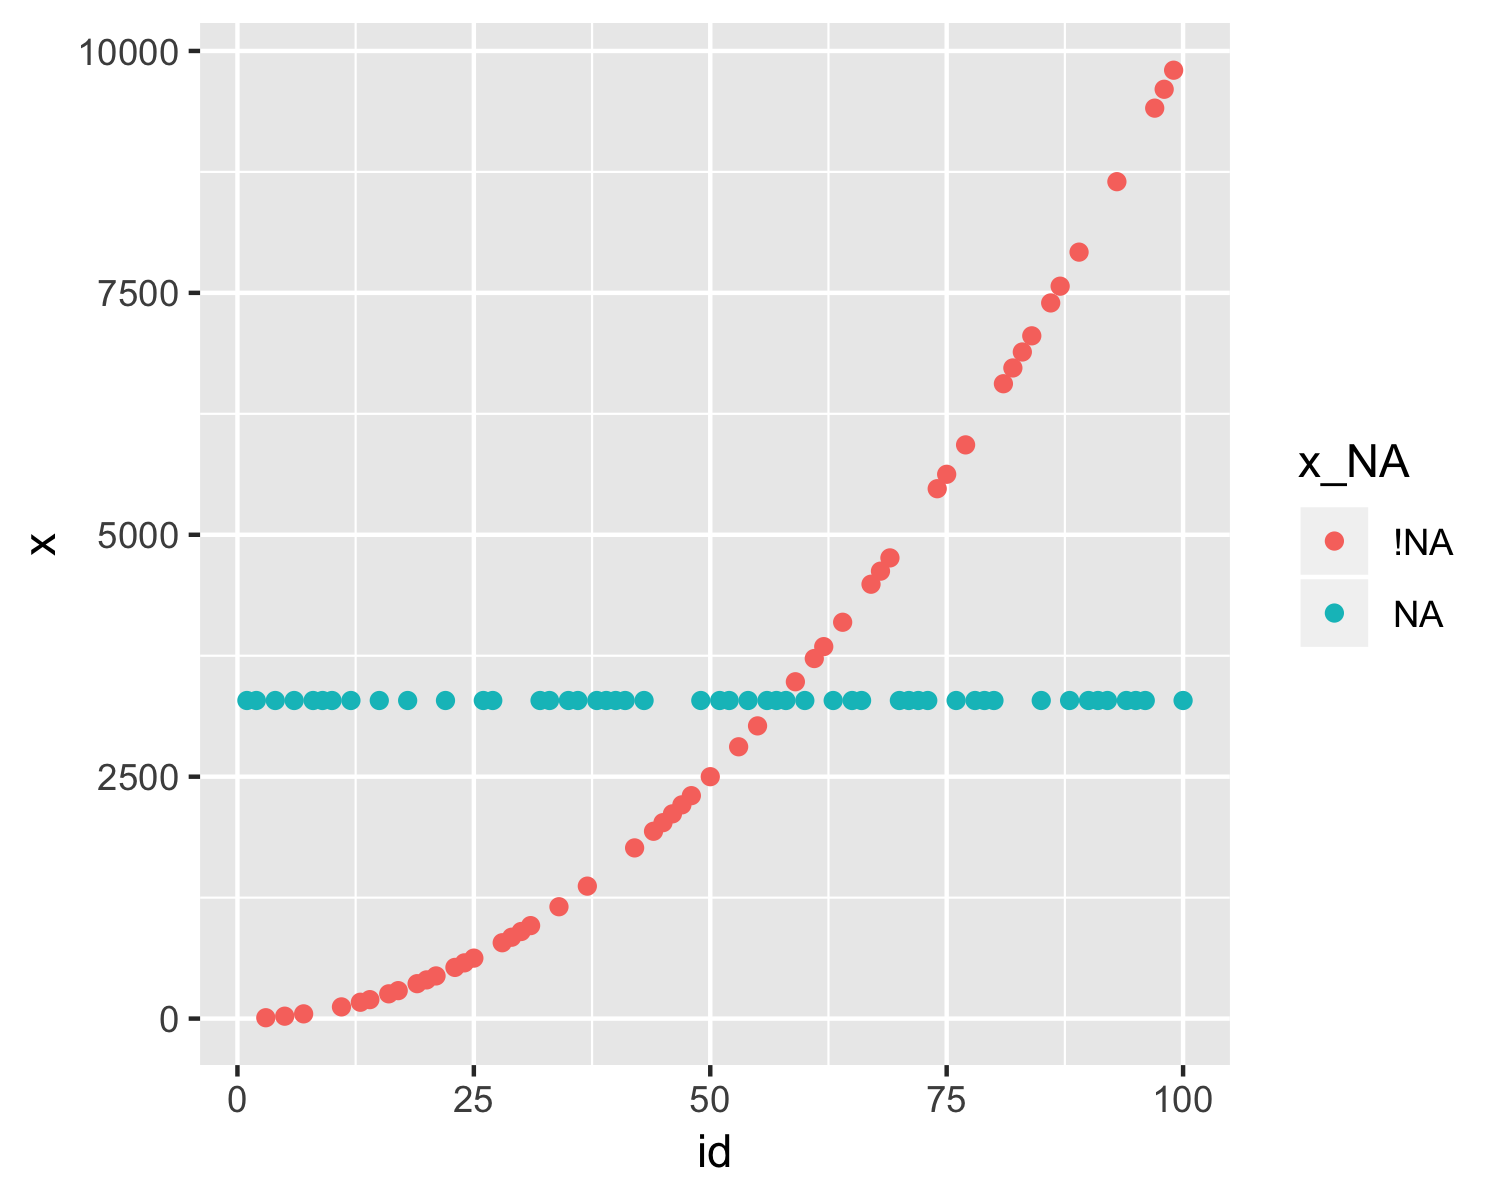
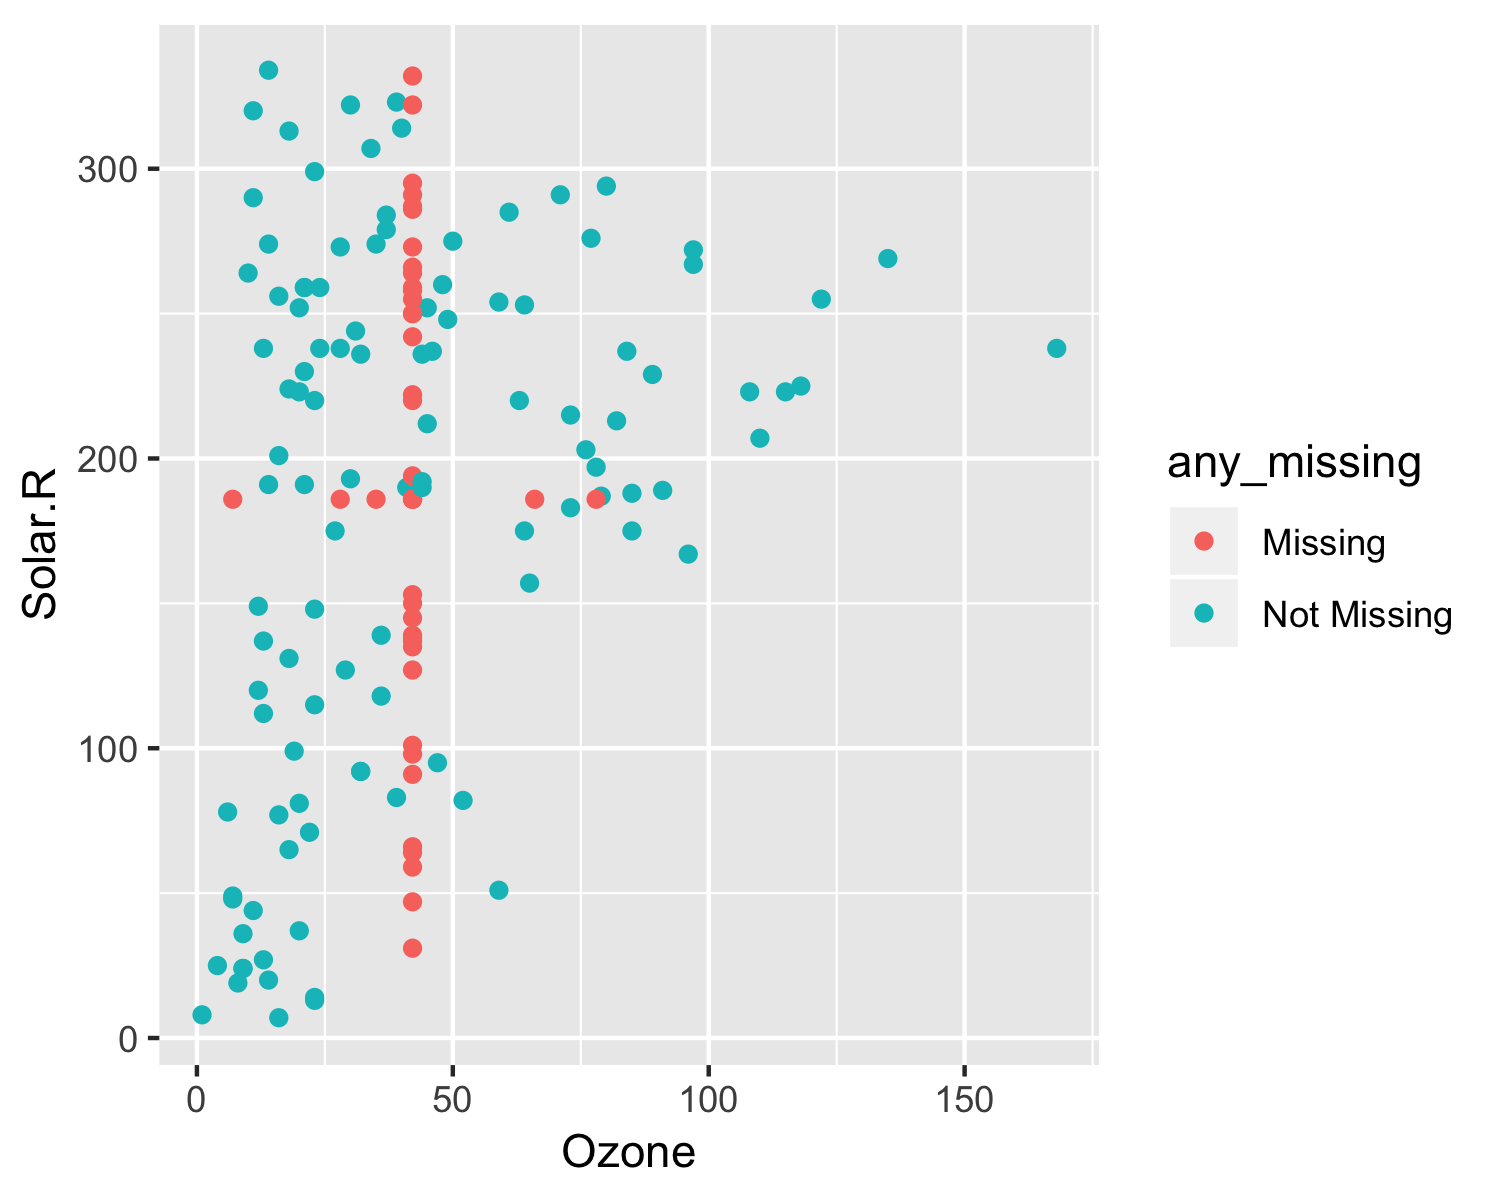
Explore bad imputations using a scatter plot

When evaluating imputations, explore changes/similarities in

  • The spread (scatter plot)
ggplot(aq_impute_mean,
       aes(x = Ozone,
           y = Solar.R,
           color = any_missing)) +
  geom_point()

Dealing With Missing Data in R

Exploring imputations for many variables

aq_imp <- airquality %>%
  bind_shadow() %>%
  impute_mean_all()

aq_imp_long <- shadow_long(aq_imp, 
                           Ozone, 
                           Solar.R)

aq_imp_long
# A tibble: 306 x 4
   variable value variable_NA value_NA
   <chr>    <dbl> <chr>       <chr>   
 1 Ozone     41   Ozone_NA    !NA     
 2 Ozone     36   Ozone_NA    !NA     
 3 Ozone     12   Ozone_NA    !NA     
 4 Ozone     18   Ozone_NA    !NA     
 5 Ozone     42.1 Ozone_NA    NA      
 6 Ozone     28   Ozone_NA    !NA     
 7 Ozone     23   Ozone_NA    !NA     
 8 Ozone     19   Ozone_NA    !NA     
 9 Ozone      8   Ozone_NA    !NA     
10 Ozone     42.1 Ozone_NA    NA      
# ... with 296 more rows
Dealing With Missing Data in R

Exploring imputations for many variables

ggplot(aq_imp_long,
       aes(x = value,
           fill = value_NA)) + 
  geom_histogram() + 
  facet_wrap(~ variable)

Dealing With Missing Data in R

Let's Practice!

Dealing With Missing Data in R

Preparing Video For Download...