Performing and tracking imputation
Dealing With Missing Data in R

Nicholas Tierney
Statistician
Using imputations to understand data structure
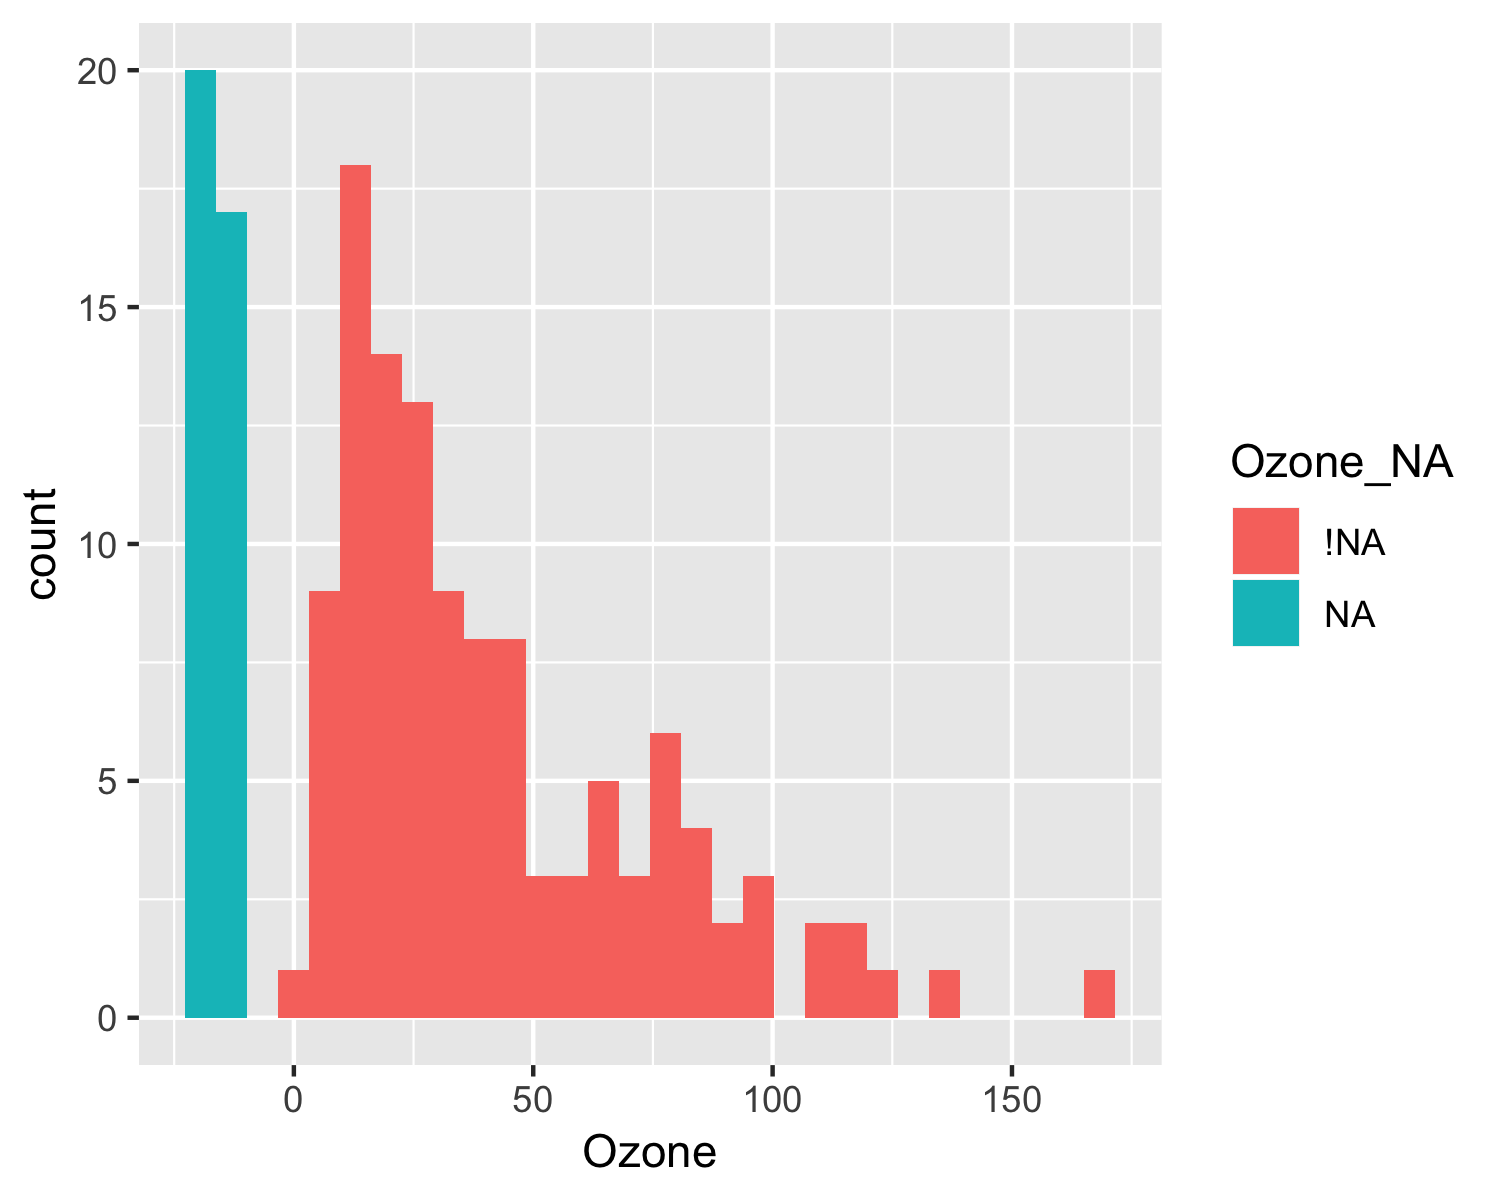
Visualize imputed values against data values using histograms
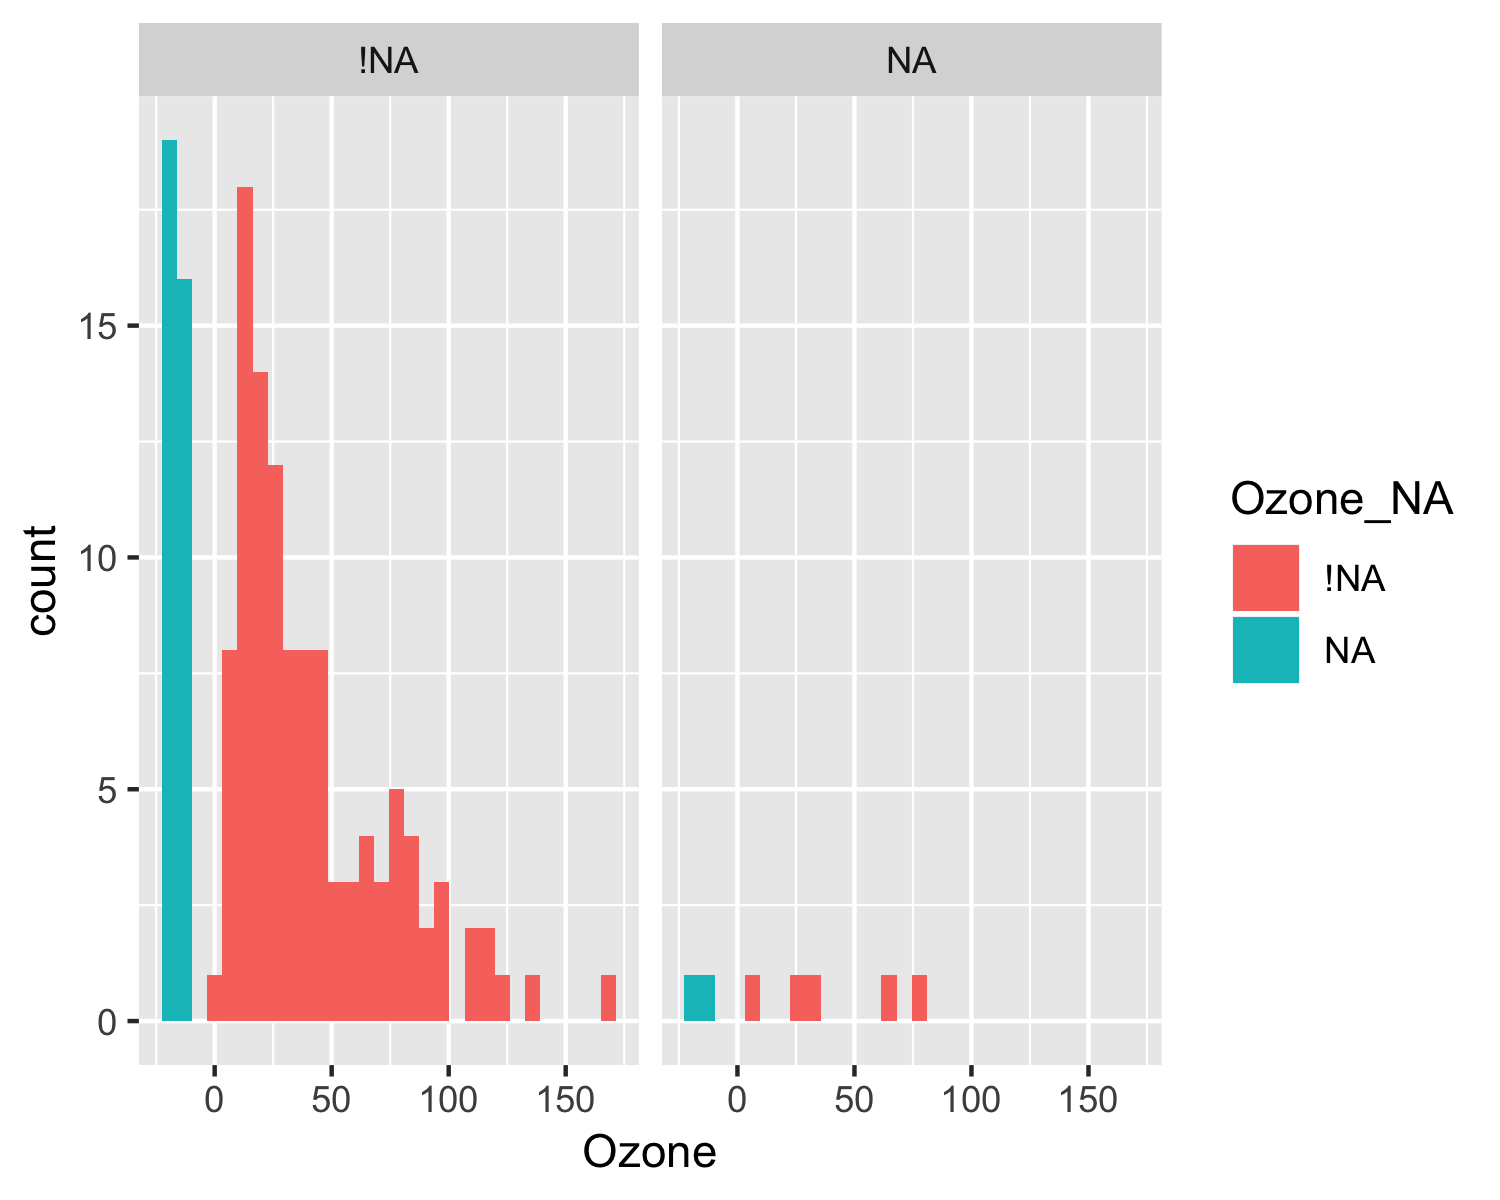
Visualize imputed values against data values using facets
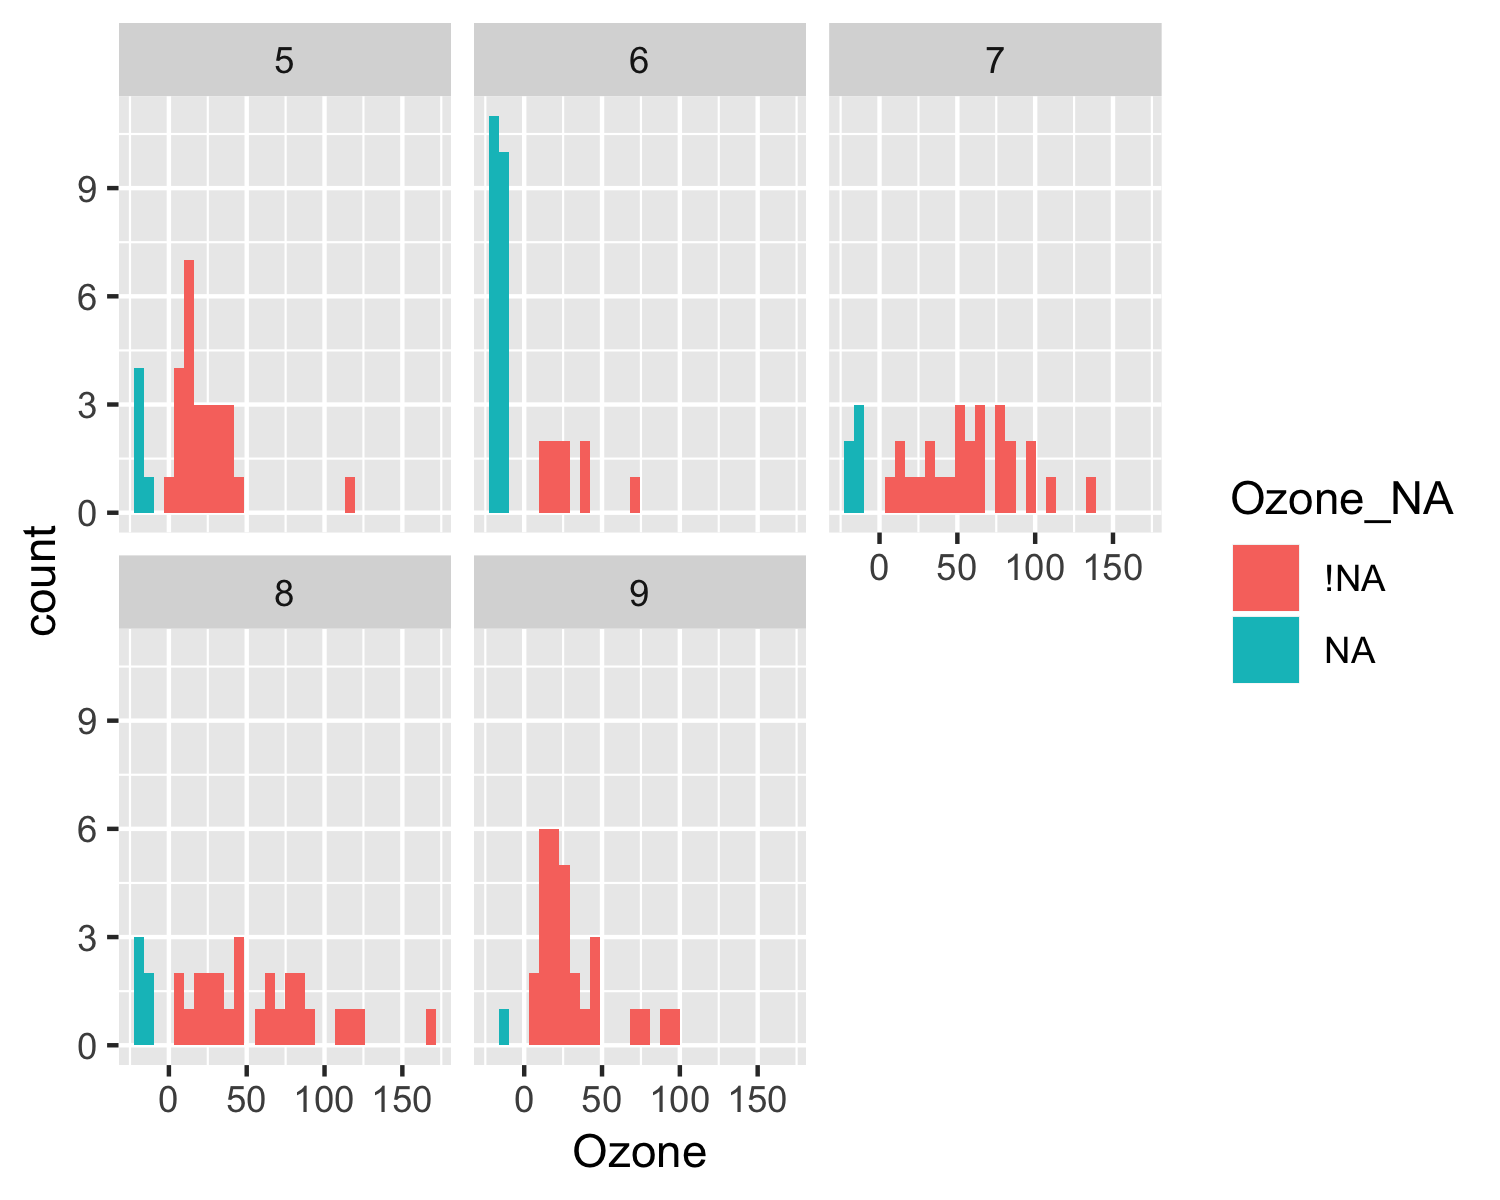
Visualize imputed values using facets
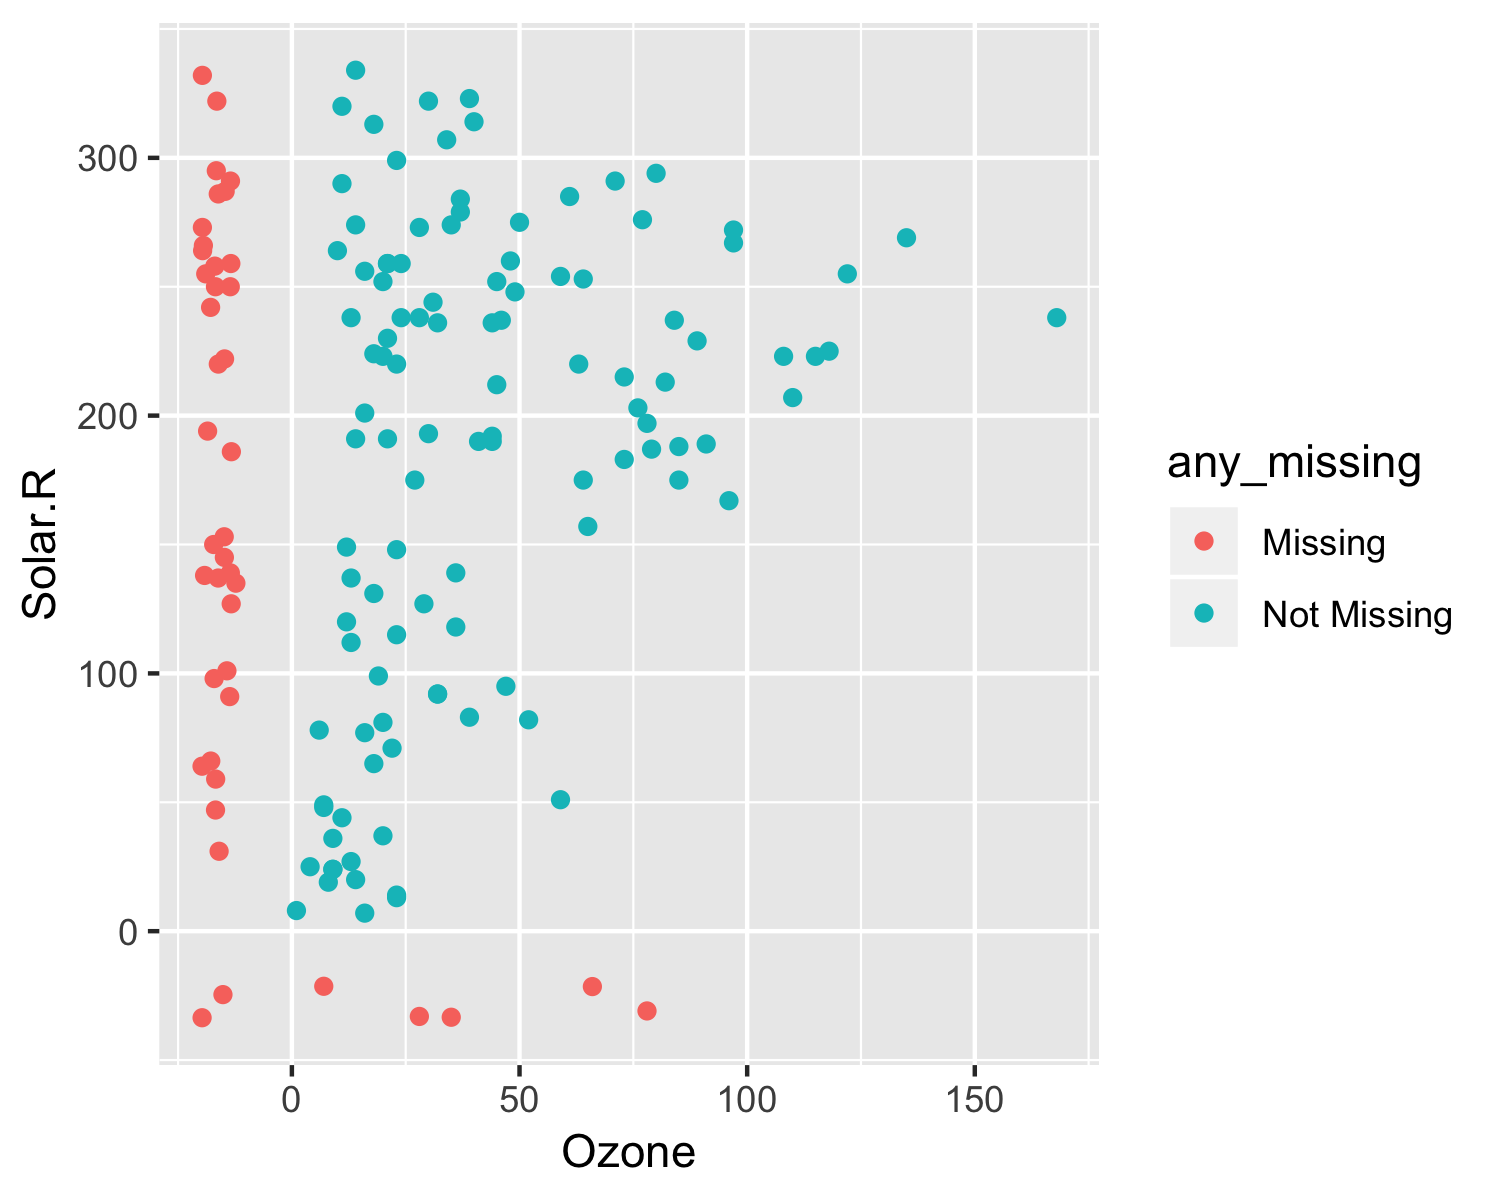
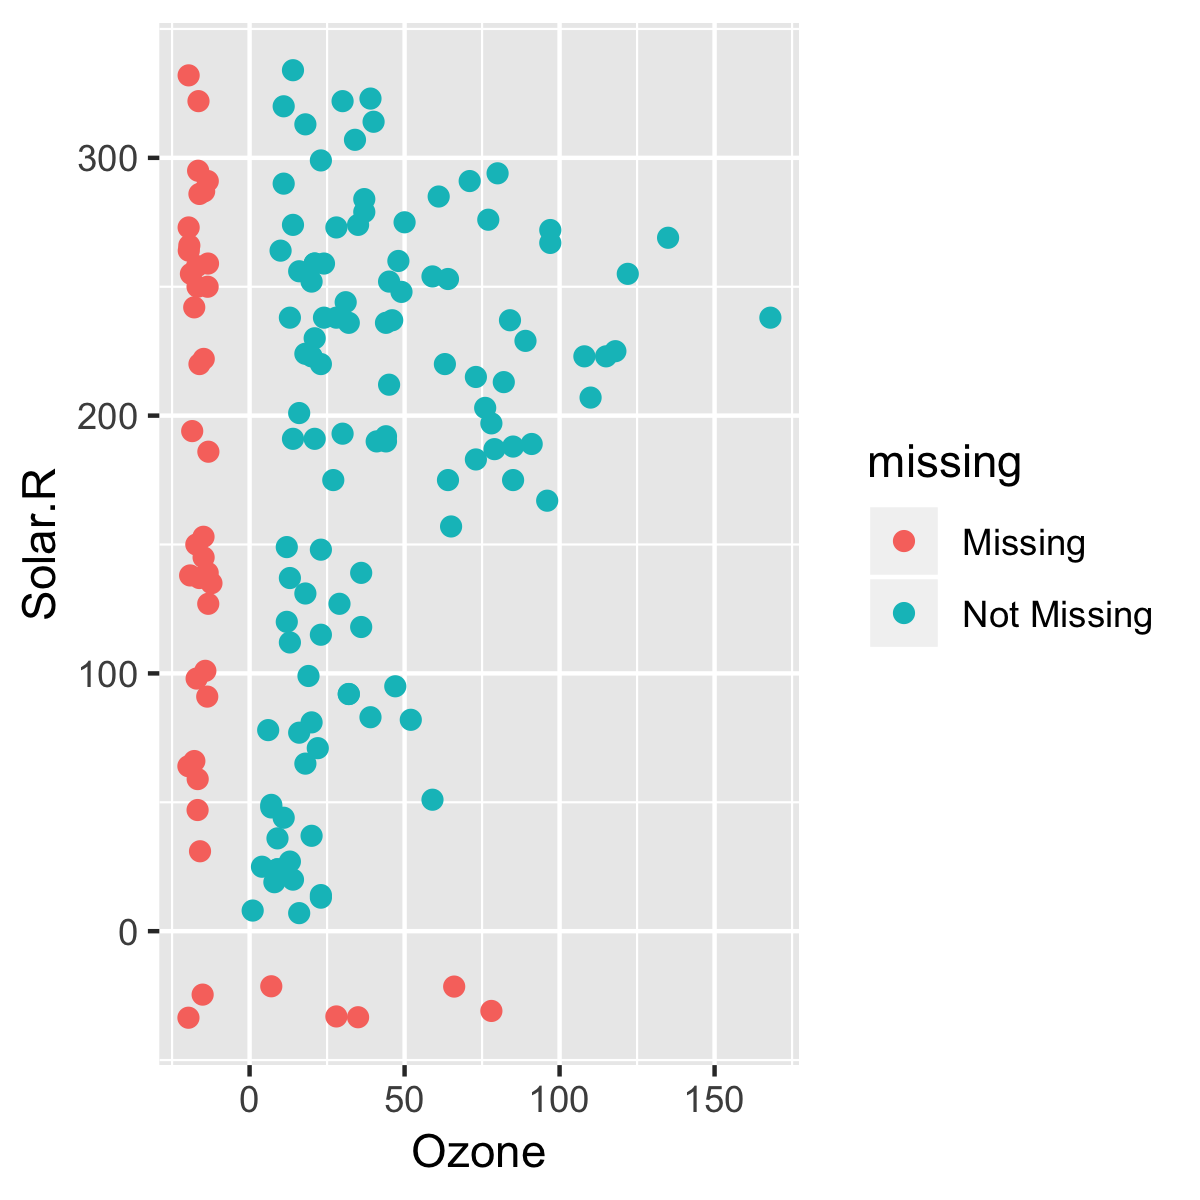
Visualize imputed values against data values using scatter plots