Choropleths with geopandas
Visualizing Geospatial Data in Python

Mary van Valkenburg
Data Science Program Manager, Nashville Software School
Choropleth with GeoDataFrame.plot()
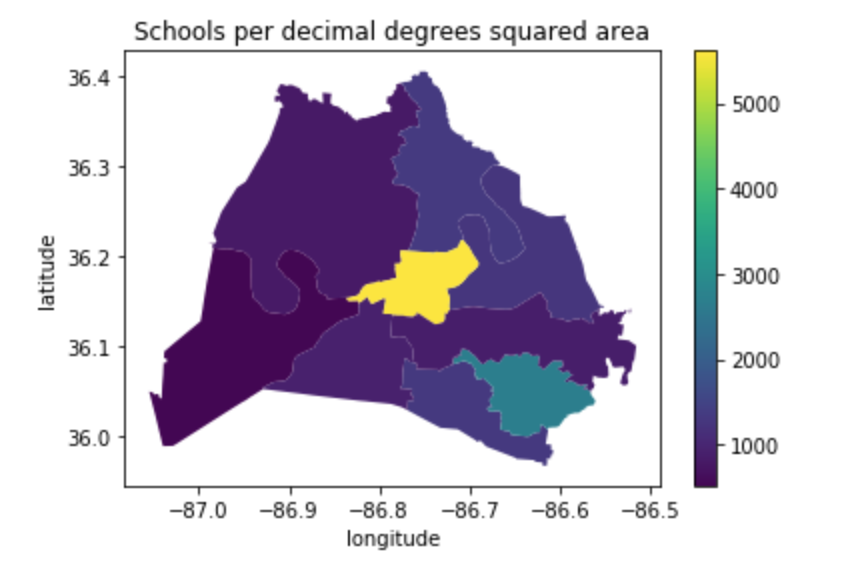
districts_with_counts.plot(column = 'school_density', legend = True)
plt.title('Schools per decimal degrees squared area')
plt.xlabel('longitude')
plt.ylabel('latitude');
Choropleth with GeoDataFrame.plot()
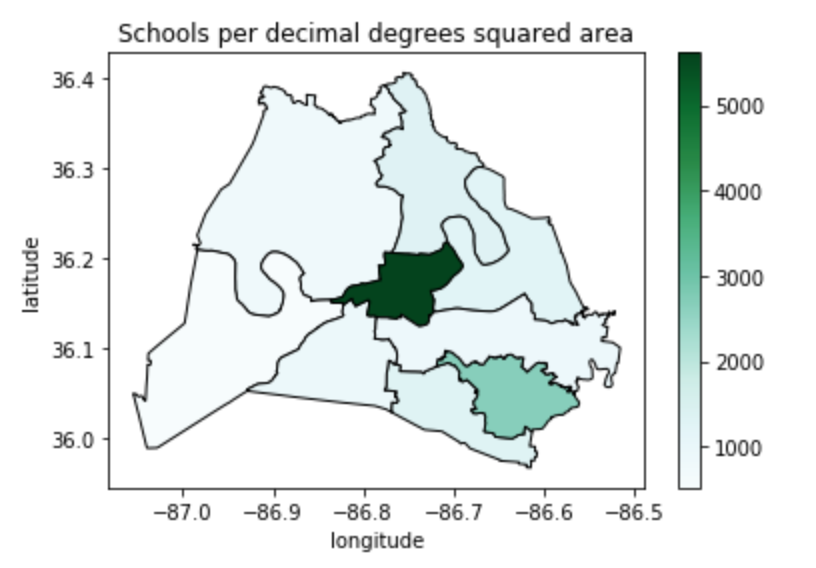
districts_with_counts.plot(column = 'school_density', cmap = 'BuGn', edgecolor = 'black', legend = True)
plt.title('Schools per decimal degrees squared area')
plt.xlabel('longitude')
plt.ylabel('latitude');