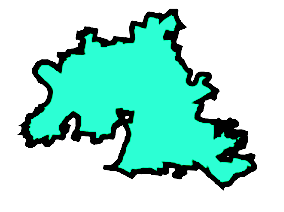
print(service_district.loc[0, 'geometry'])
POLYGON ((-86.68680500011935 36.28670500013504,
-86.68706099969657 36.28550299967364, -86.68709498823965 36.28511683351293,
-86.68712691935902 36.28475404474551, -86.6871549990252 36.28443499969863,
-86.68715025108719 36.28438104319917, -86.68708600011215 36.2836510002216,
-86.6870599998375 36.28335400009232, -86.68683200030846 36.28073200026927,
-86.68678671280243 36.2804916722591, -86.68668199966068 36.27993600019391,
-86.686543000303 36.27920000021985, -86.68641799989246 36.27853199938513,
-86.68600744248923 36.27759483150202, -86.68579942352289 36.27711998225582,
-86.68482299948184 36.2748910007355, -86.68476799897849 36.27478700083996,
-86.68372700043393 36.27281799971492, -86.6832880000829 36.27208000018629,
-86.68313199902317 36.27181700012145, -86.68278700024624 36.27108100075766,
-86.68257822861736 36.27077209799597, -86.68177585777893 36.2694062861527....