GeoSeries attributes and methods II
Visualizing Geospatial Data in Python

Mary van Valkenburg
Data Science Program Manager, Nashville Software School
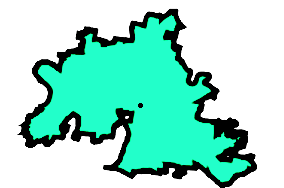
GeoSeries.centroid
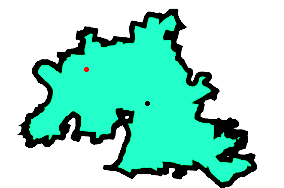
GeoSeries.distance()
Visualizing Geospatial Data in Python
Mary van Valkenburg
Data Science Program Manager, Nashville Software School

