Introduction
Visualizing Geospatial Data in Python

Mary van Valkenburg
Data Science Program Manager, Nashville Software School
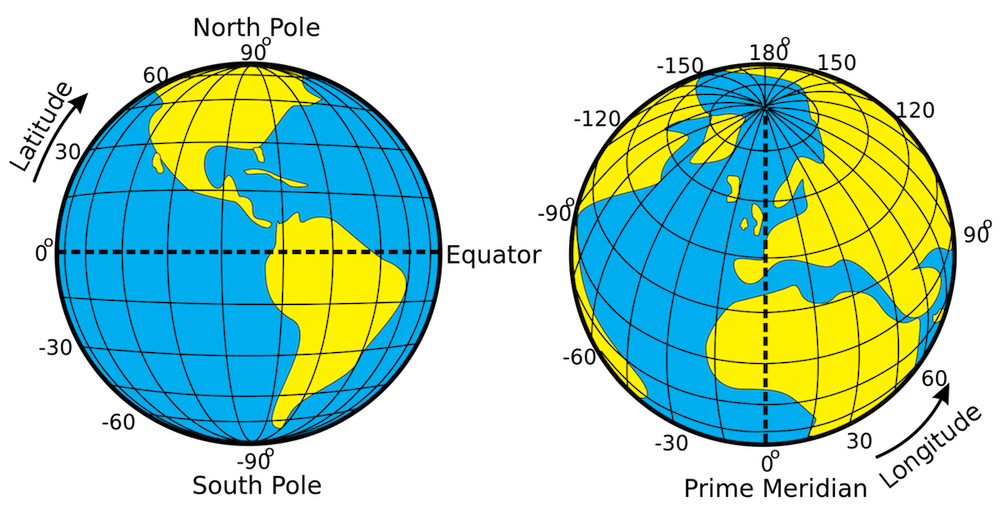
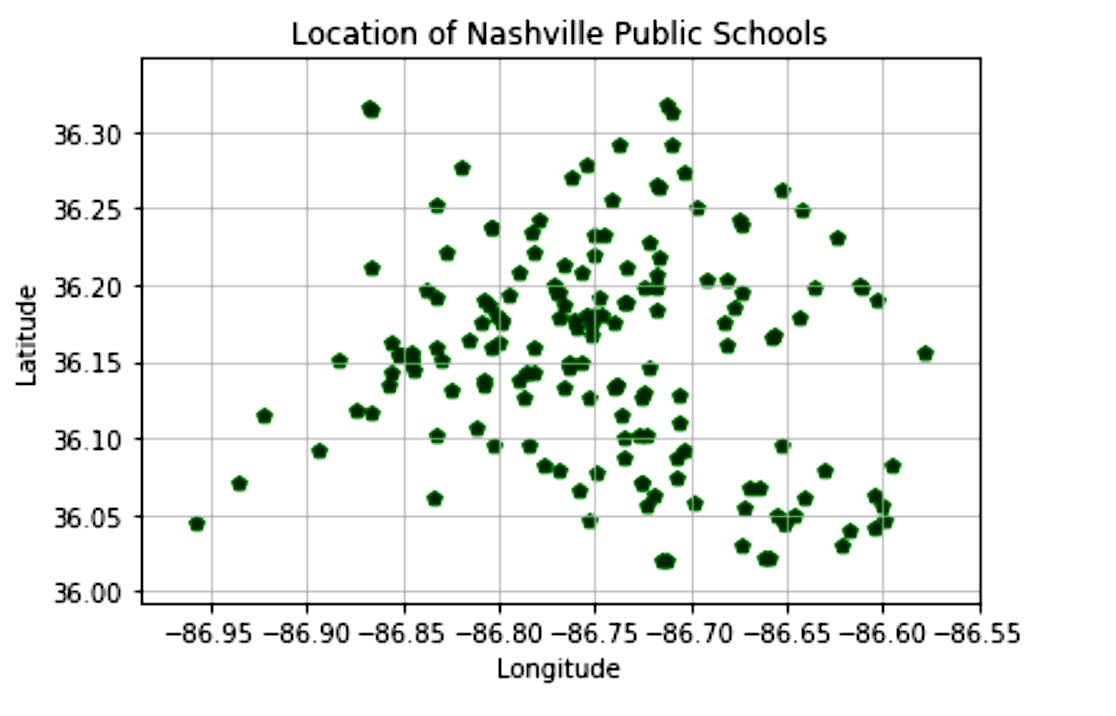
Location

Longitude and latitude
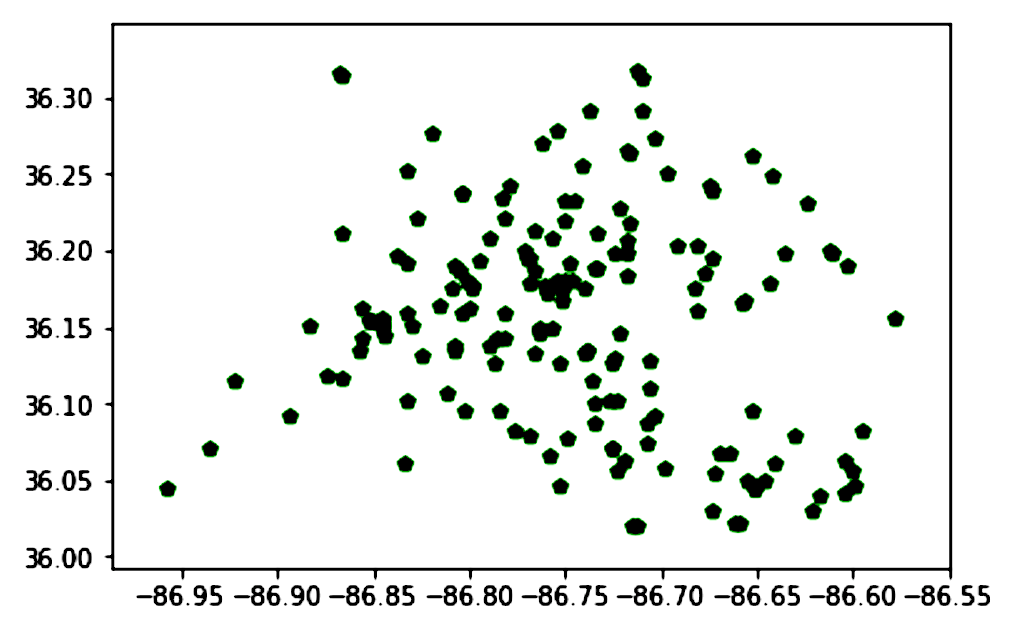
plt.scatter(schools.Longitude,
            schools.Latitude,
            c = 'darkgreen',
            marker = 'p')
plt.show()
plt.scatter(schools.Longitude, schools.Latitude,
            c = 'darkgreen', marker = 'p')
plt.xlabel('Longitude')
plt.ylabel('Latitude')
plt.title('Nashville Public Schools')
plt.grid()
plt.show()
Nashville open data


