Visualizing Geospatial Data in Python
Mary van Valkenburg
Data Science Program Manager, Nashville Software School
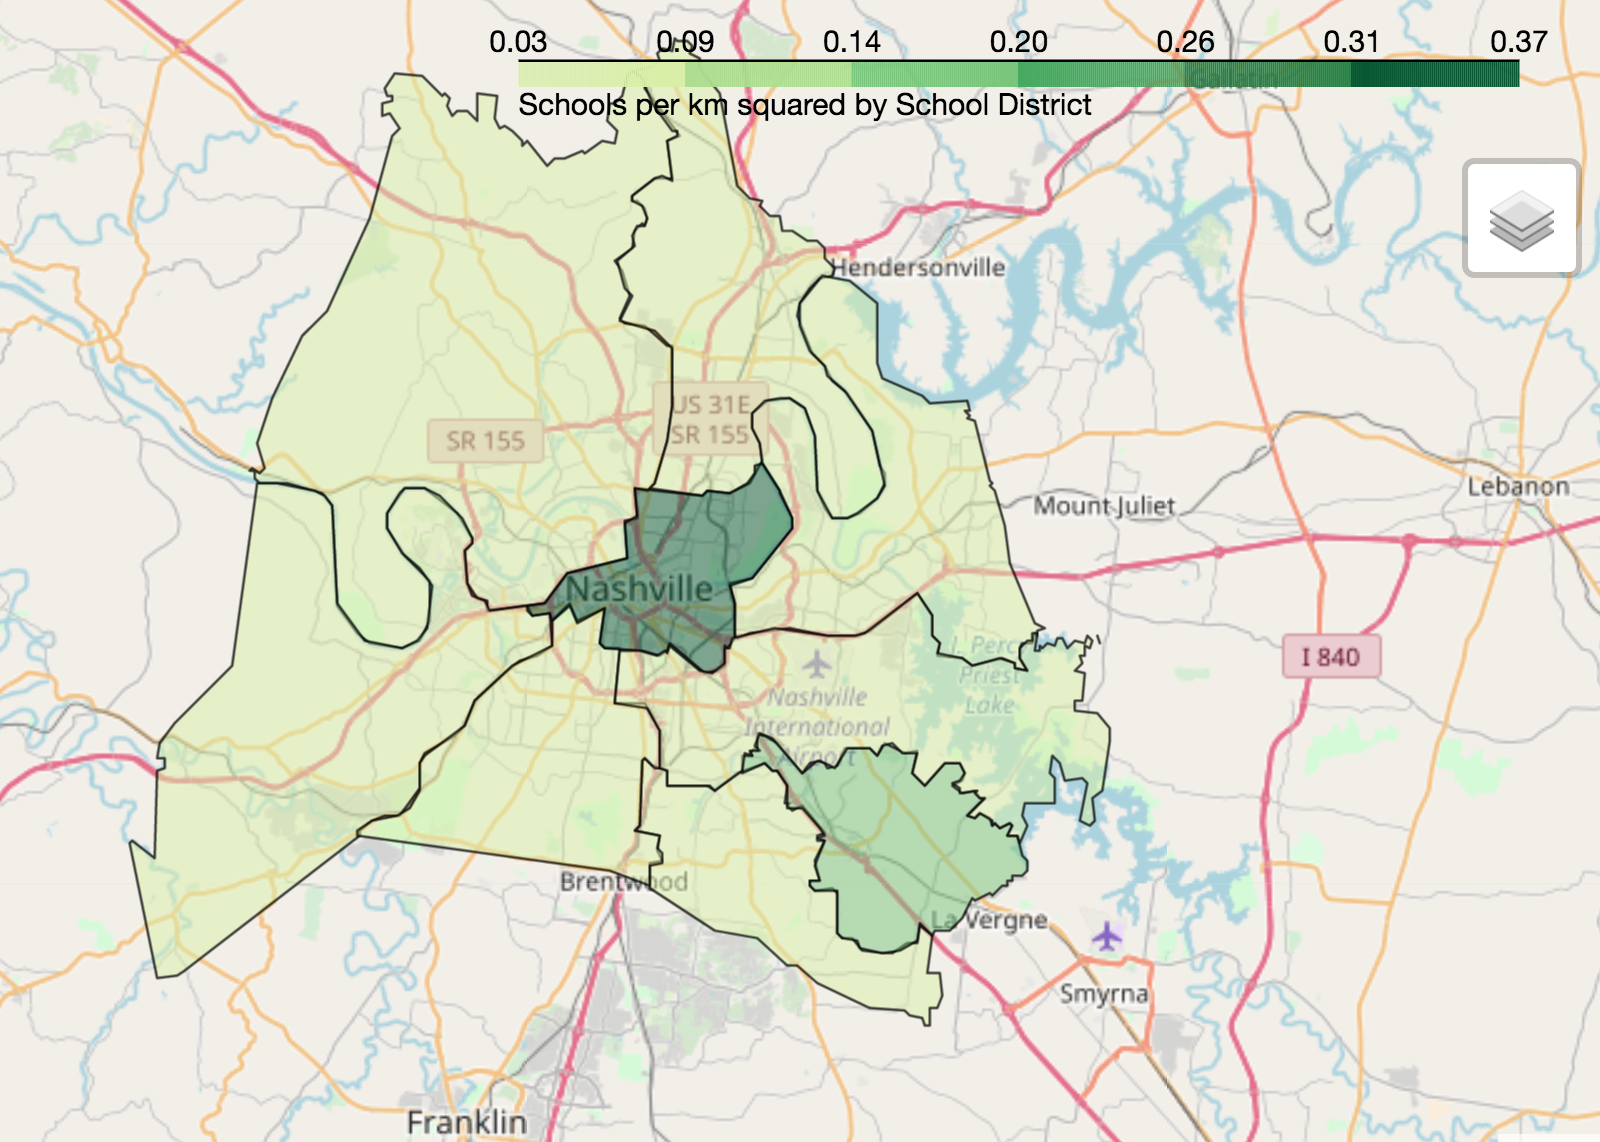
# Construct a map object for Nashville
nashville = [36.1636,-86.7823]
m = folium.Map(location=nashville, zoom_start=10)
# Create a choropleth using the folium Choropleth class
folium.Choropleth(...)
geo_data
- the source data for the polygons (geojson file or a GeoDataFrame)name
- the name of the geometry column (or geojson property) for the polygonsdata
- the source DataFrame or Series for the normalized datacolumns
- a list of columns: one that corresponds to the polygons and one that has the value to plotkey_on
- a GeoJSON variable to bind the data to (always starts with feature
)fill_color
- polygon fill color (defaults to blue) fill_opacity
- range between 0 (transparent) and 1 (completely opaque)line_color
- color of polygon border lines (defaults to black)line_opacity
- range between 0 (transparent) and 1 (completely opaque) legend_name
- creates a title for the legend# Center point and map for Nashville
nashville = [36.1636,-86.7823]
m = folium.Map(location=nashville, zoom_start=10)
# Define a choropleth layer for the map
folium.Choropleth(
geo_data=districts_with_counts,
name='geometry',
data=districts_with_counts,
columns=['district', 'school_density'],
key_on='feature.properties.district',
fill_color='YlGn',
fill_opacity=0.75,
line_opacity=0.5,
legend_name='Schools per km squared by School District'
).add_to(m)
folium.LayerControl().add_to_map()
display(m)
Visualizing Geospatial Data in Python