GeoSeries attributes and methods I
Visualizing Geospatial Data in Python

Mary van Valkenburg
Data Science Program Manager, Nashville Software School
Shapely attributes and methods
# the geometry column is a GeoSeries
type(school_districts.geometry)
geopandas.geoseries.GeoSeries
GeoSeries.area- returns the area of each geometry in a GeoSeriesGeoSeries.centroid- returns the center point of each geometry in a GeoSeriesGeoSeries.distance(other)- returns the minimum distance toother
GeoSeries.area
- returns the area of each geometry in a GeoSeries
# area of first polygon in districts
print(districts.geometry[0].area)
325.78

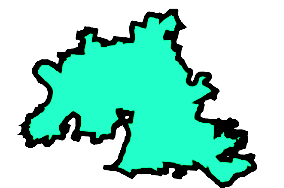
School district areas
GeoSeries.area
# print first 4 rows of school districts and the total number of rows
print(school_districts.head(4))
print('There are ', school_districts.shape[0], ' school districts.' )
first_name  last_name    position  district  geometry
Sharon      Gentry       Member       1      (POLYGON ((-86.771 36.383...)))
Jill        Speering     Vice-Chair   3      (POLYGON ((-86.753 36.404...)))
Jo Ann      Brannon      Member       2      (POLYGON ((-86.766 36.083...)))
Anna        Shepherd     Chair        4      (POLYGON ((-86.580 36.209...)))
There are  9  school districts.
# calculate area of each school district
district_area = school_districts.area
# print the areas and crs used
print(district_area.sort_values(ascending = False))
print(school_districts.crs)
0    0.036641
4    0.023030
8    0.015004
1    0.014205
3    0.014123
5    0.010704
2    0.008328
7    0.007813
6    0.006415
dtype: float64
epsg:4326
# create a copy of school_districts that uses EPSG:3857 school_districts_3857 = school_districts.to_crs(epsg = 3857)# define a variable for m^2 to km^2 and get area in kilometers squared sqm_to_sqkm = 10**6 district_area_km = school_districts_3857.area / sqkm_to_sqm print(district_area_km.sort_values(ascending = False)) print(school_districts_3857.crs)
0    563.134380
4    353.232132
8    230.135653
1    218.369949
3    216.871511
5    164.137548
2    127.615396
7    119.742279
6     98.469632
dtype: float64
epsg:3857
Let's Practice!
Visualizing Geospatial Data in Python

