Projections and Coordinate Reference Systems

Visualizing Geospatial Data in Python

Mary van Valkenburg

Data Science Program Manager, Nashville Software School
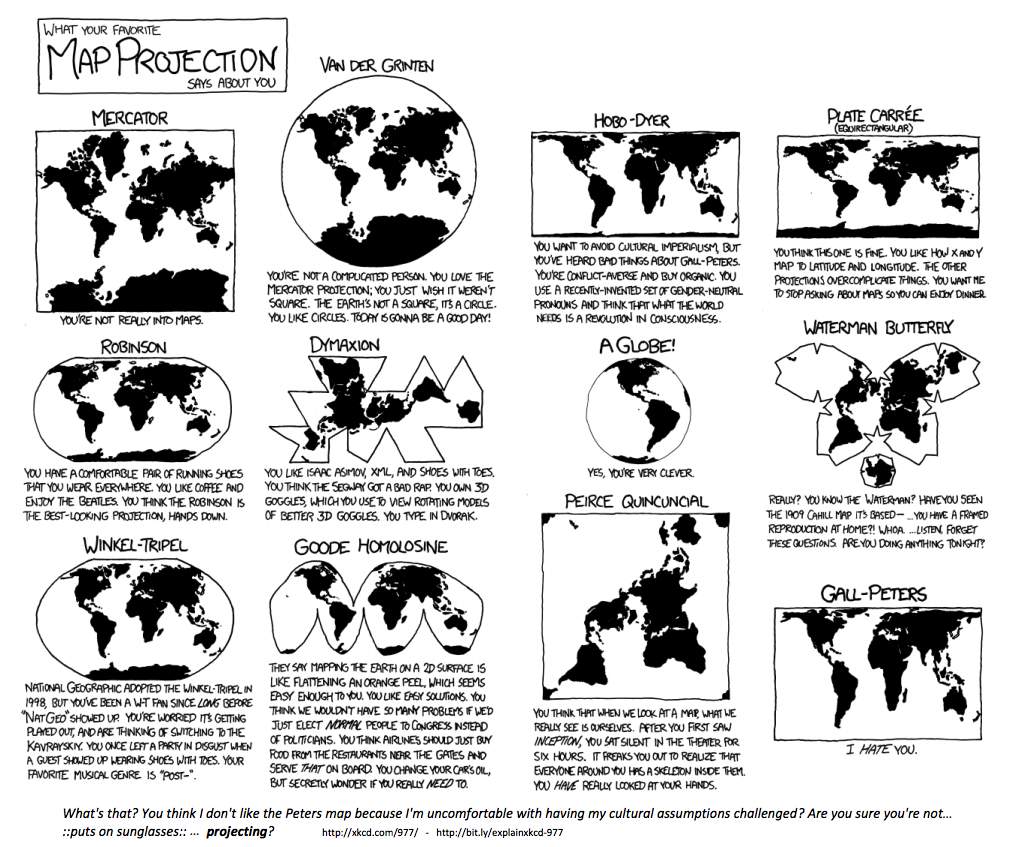
Projections

flattened map of spherical earth

Visualizing Geospatial Data in Python

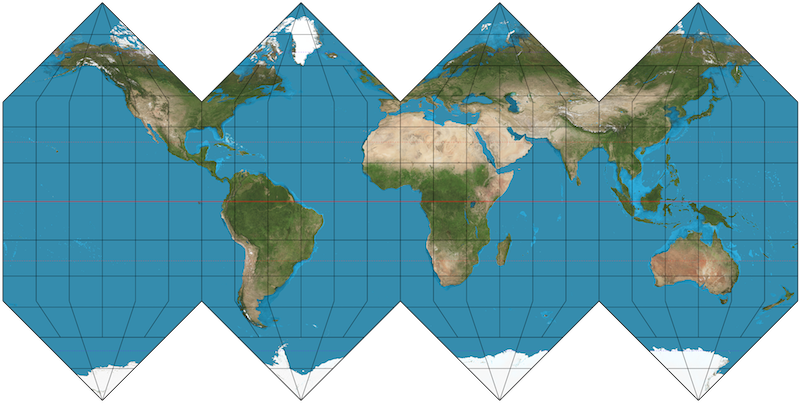
Many approaches to map projection

xkcd comic on map projections

Visualizing Geospatial Data in Python

Coordinate Reference Systems

EPSG:4326

  • Used by Google Earth
  • Units: decimal degrees

EPSG:3857

  • Used by Google Maps, Bing Maps, Open Street Maps
  • Units: meters
Visualizing Geospatial Data in Python
School Name              Latitude     Longitude
A. Z. Kelley Elementary    36.021       -86.658
Alex Green Elementary      36.252       -86.832
Amqui Elementary           36.273       -86.703
Andrew Jackson Elementary  36.231       -86.623
import geopandas as gpd
schools['geometry'] = gpd.points_from_xy(schools.Longitude, schools.Latitude)
schools.head(4)
School Name                Latitude  Longitude                geometry
A. Z. Kelley Elementary      36.021    -86.658  POINT (-86.658 36.021)
Alex Green Elementary        36.252    -86.832  POINT (-86.832 36.252)
Amqui Elementary             36.273    -86.703  POINT (-86.703 36.273)
Andrew Jackson Elementary    36.231    -86.623  POINT (-86.623 36.231)
Visualizing Geospatial Data in Python

Creating a GeoDataFrame from a DataFrame

import geopandas as gpd

schools_geo = gpd.GeoDataFrame(schools, 
                               crs = 'epsg:4326', 
                               geometry = schools.geometry)
schools_geo.head(4)
School Name                Latitude  Longitude               geometry
A. Z. Kelley Elementary      36.021    -86.658  POINT (-86.658 36.021)
Alex Green Elementary        36.252    -86.832  POINT (-86.832 36.252)
Amqui Elementary             36.273    -86.703  POINT (-86.703 36.273)
Andrew Jackson Elementary    36.231    -86.623  POINT (-86.623 36.231)
Visualizing Geospatial Data in Python

Changing from one CRS to another

schools_geo.head(2)
School Name              Latitude  Longitude                geometry
A. Z. Kelley Elementary    36.021    -86.658  POINT (-86.658 36.021)
Alex Green Elementary      36.252    -86.832  POINT (-86.832 36.252)
schools_geo.geometry = schools_geo.geometry.to_crs(epsg = 3857)
schools_geo.head(2)
School Name              Latitude  Longitude                      geometry
A. Z. Kelley Elementary    36.021    -86.658  POINT (-9646818.8 4303623.8)
Alex Green Elementary      36.252    -86.832  POINT (-9666119.5 4335484.4)
Visualizing Geospatial Data in Python

Let's practice!

Visualizing Geospatial Data in Python

Preparing Video For Download...