Creating markers and popups in folium
Visualizing Geospatial Data in Python

Mary Van Valkenburg
Data Science Program Manager, Nashville Software School
Building marker locations

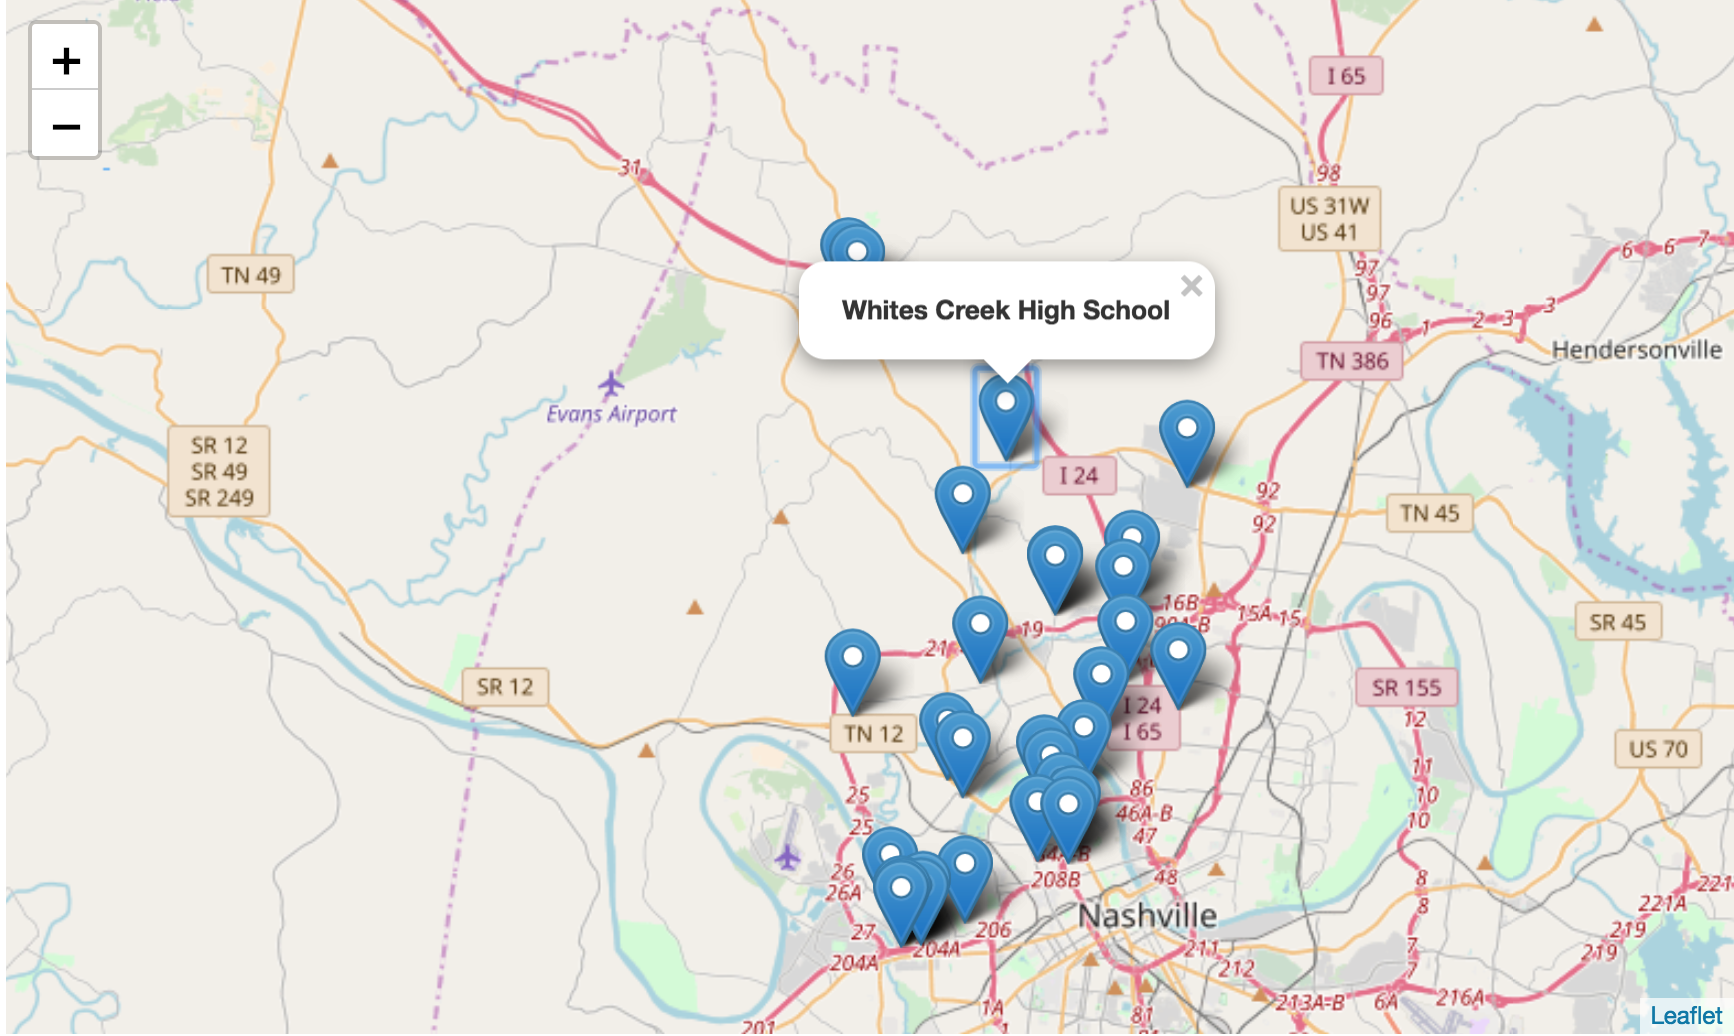
Creating popups from data in a DataFrame
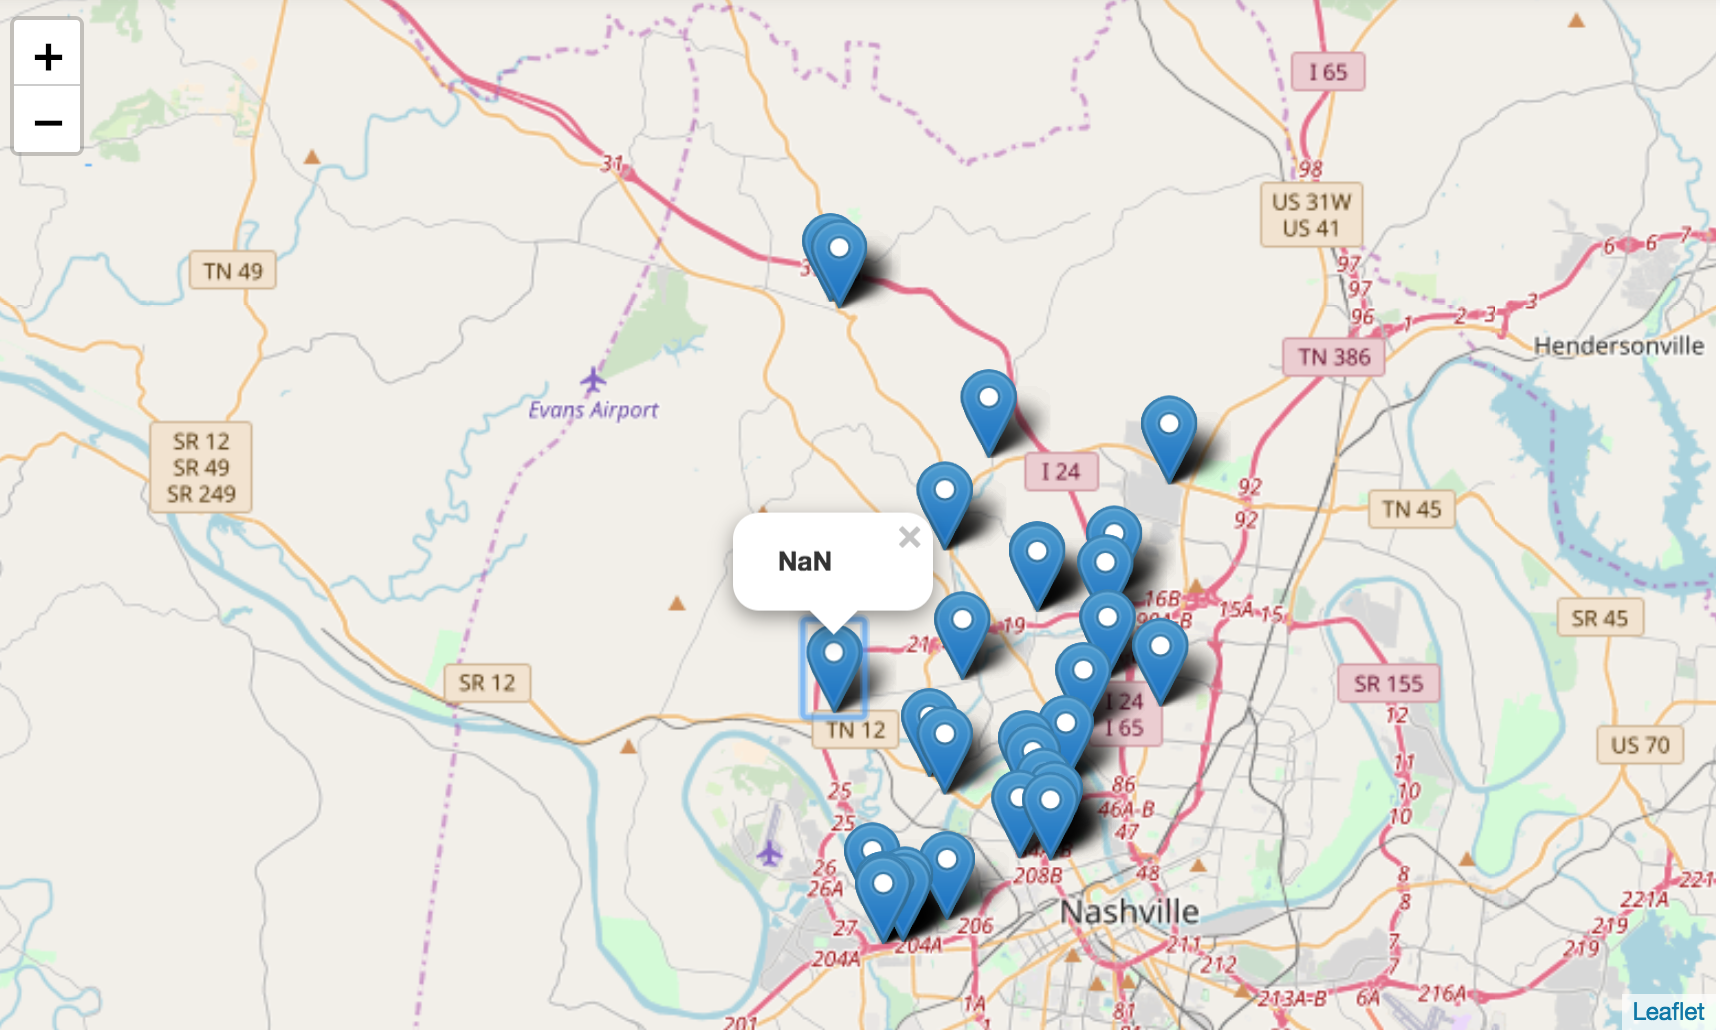
Troubleshooting popups
Visualizing Geospatial Data in Python
Mary Van Valkenburg
Data Science Program Manager, Nashville Software School

