Plotting with GeoJSON
Visualizing Geospatial Data in Python

Mary van Valkenburg
Data Science Program Manager, Nashville Software School
Geopandas dependencies
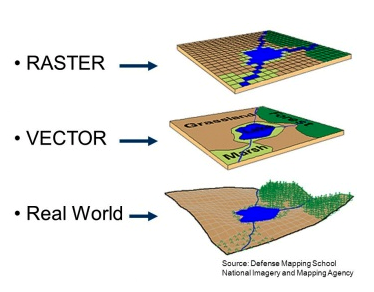
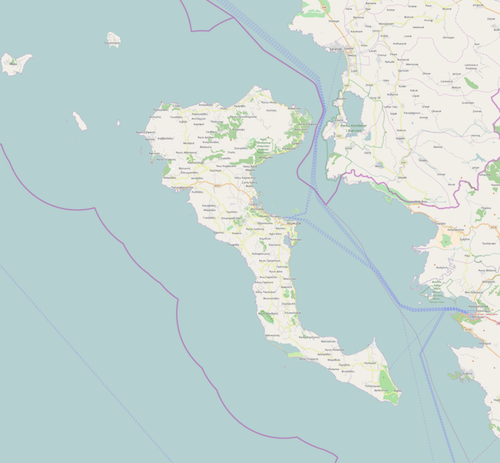
Comparing raster and vector graphics
raster image of Corfu
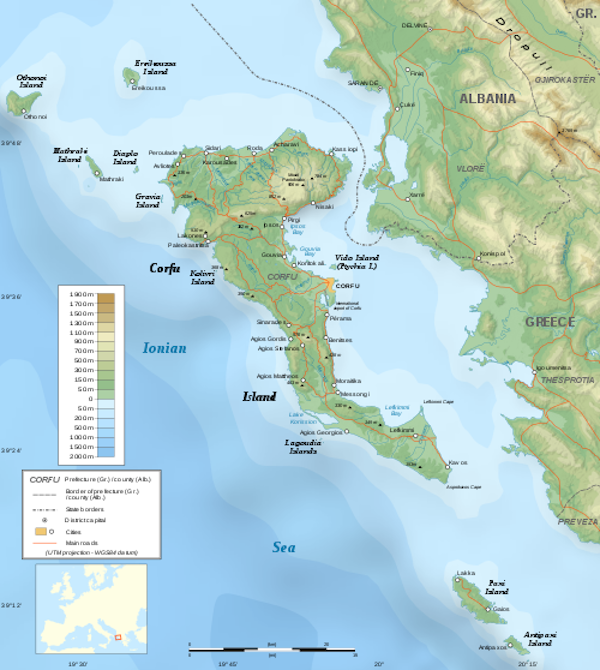
vector image of Corfu
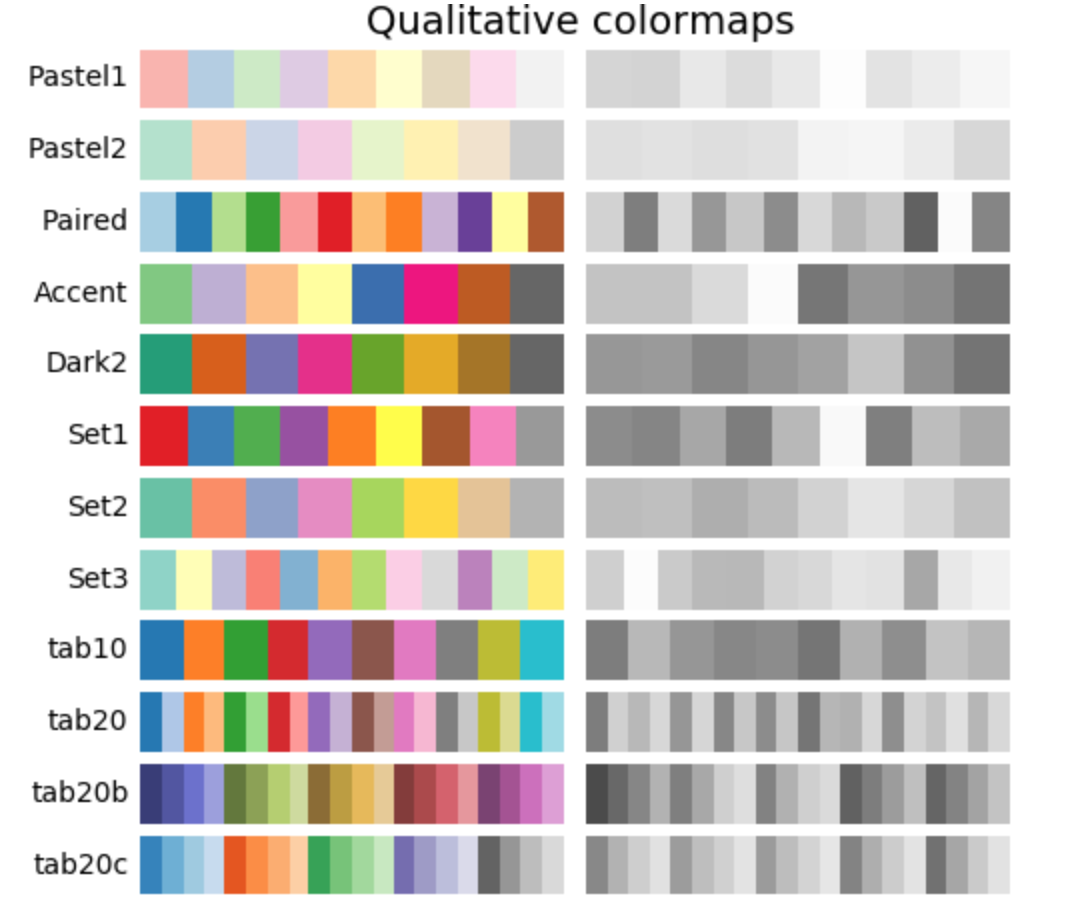
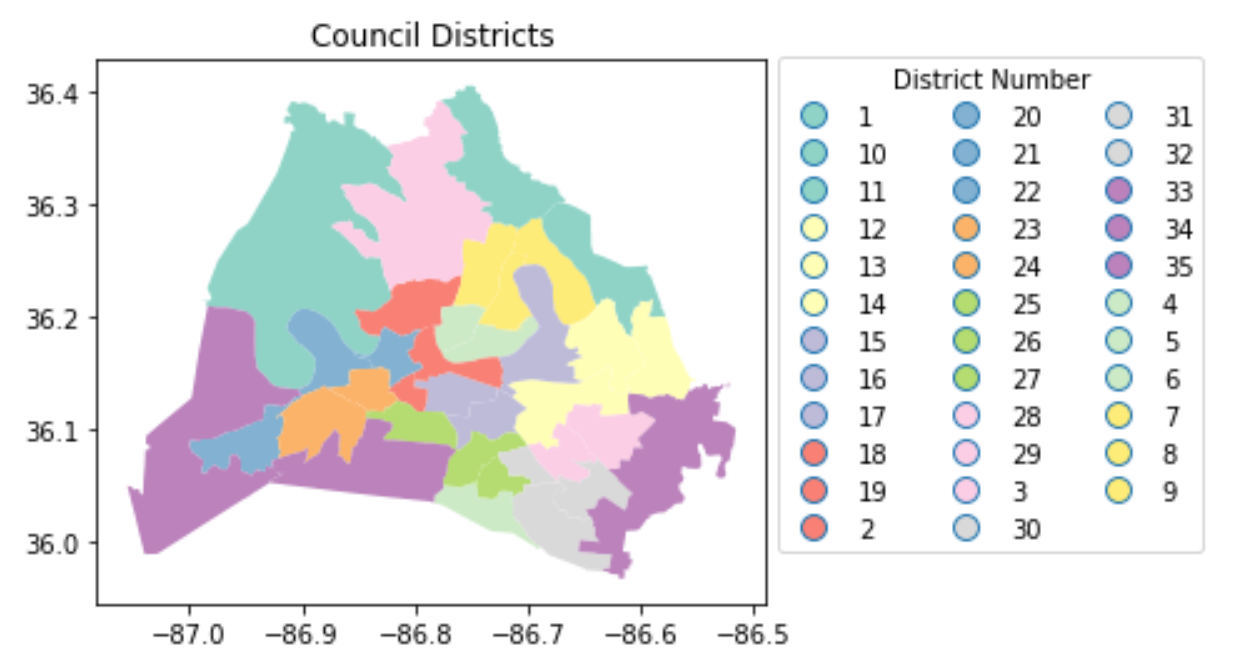
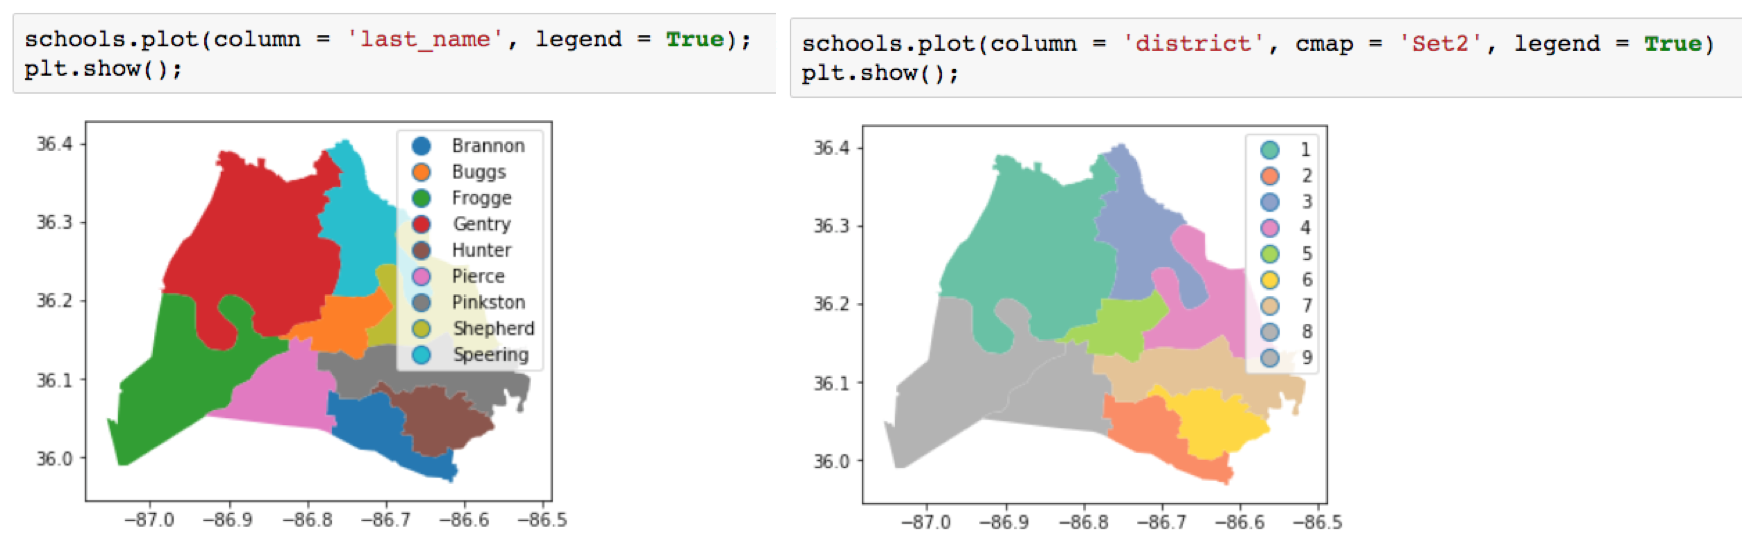
Plotting with color
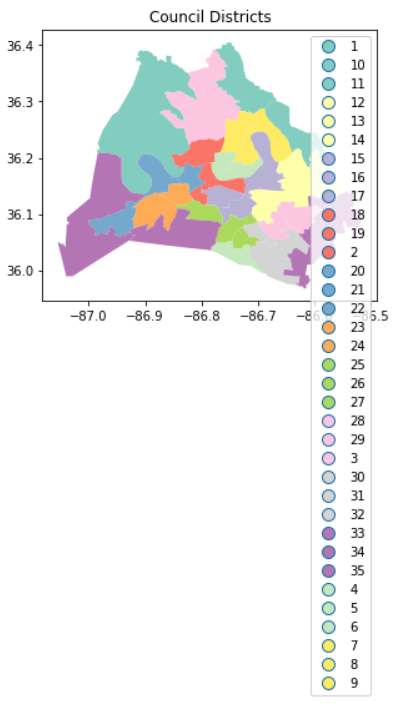
council_dists.plot(
                   column='district',
                   cmap='Set3',
                   legend=True)
plt.title('Council Districts')
plt.show();
leg_kwds={'title':'District Number',
          'loc': 'upper left',
          'bbox_to_anchor':(1, 1.03),
          'ncol':3}
council_dists.plot(column='district',
                   cmap='Set3',
                   legend=True,
             legend_kwds=leg_kwds)
plt.title('Council Districts')
plt.show();