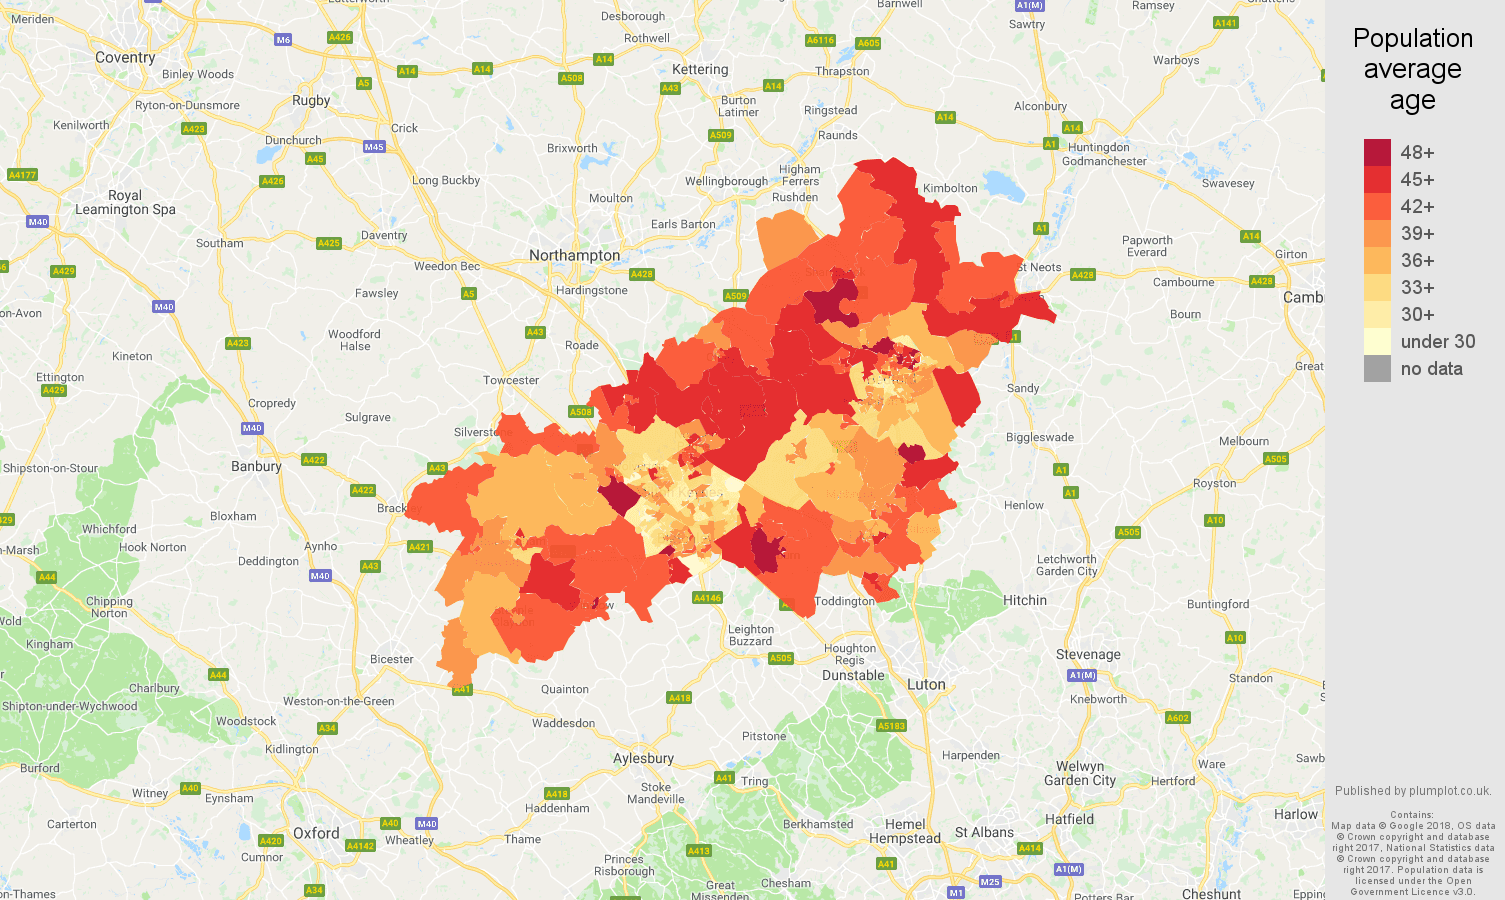
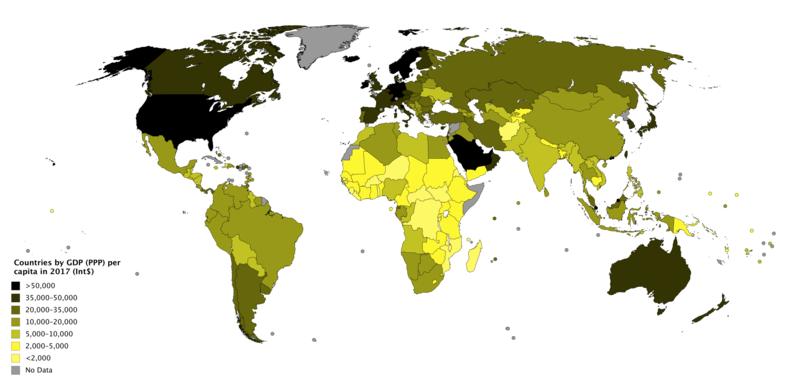
Visualizing Geospatial Data in Python
Mary van Valkenburg
Data Science Program Manager, Nashville Software School
schools_in_districts.head(2)
district geometry name lat lng
1 (POLYGON ((-86.77 36.38... Nashville Prep 36.16 -86.85
1 (POLYGON ((-86.77 36.38... Rocketship Prep 36.17 -86.79
school_counts = schools_in_districts.groupby(['district']).size()
print(school_counts)
district
1 30
2 11
3 19
4 18
5 36
6 21
7 13
8 10
9 12
dtype: int64
school_counts_df = school_counts.to_frame()
school_counts_df = school_counts_df.reset_index()
school_counts_df.columns = ['district', 'school_count']
districts_with_counts = pd.merge(school_districts, school_counts_df,
on = 'district')
districts_with_counts.head(2)
district geometry school_count
1 (POLYGON ((-86.77 36.38... 30
3 (POLYGON ((-86.75 36.40... 19
districts_with_counts['area'] = districts_with_counts.area
districts_with_counts['school_density'] = districts_with_counts.apply(
lambda row: row.school_count/row.area, axis = 1)
districts_with_counts.head(2)
district geometry school_count area school_density
1 (POLYGON ((-86.77 36.38... 30 0.036641 818.745403
3 (POLYGON ((-86.75 36.40... 19 0.014205 1337.594495
Visualizing Geospatial Data in Python