Putting it all together

Visualizing Geospatial Data in Python

Mary van Valkenburg

Data Science Program Manager, Nashville Software School

Skills list

  • Understanding longitude and latitude
  • Extracting longitude and latitude
  • Plotting points on scatterplot using longitude and latitude
  • Styling scatterplots for better aesthetics and insight
  • Plotting polygons from shapefiles
Visualizing Geospatial Data in Python

Combining scatterplots and polygons

scatterplot of school locations

plot of school districts

Visualizing Geospatial Data in Python
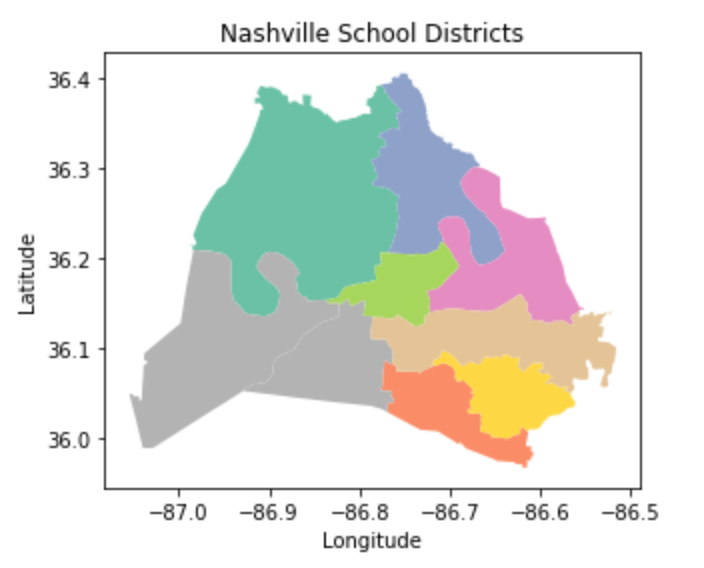
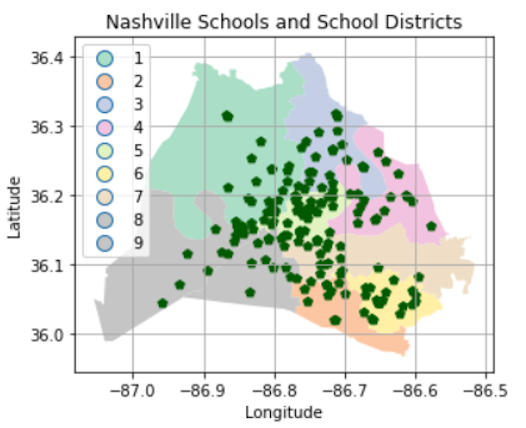
school_districts.plot(column = 'district', legend = True, cmap = 'Set2')
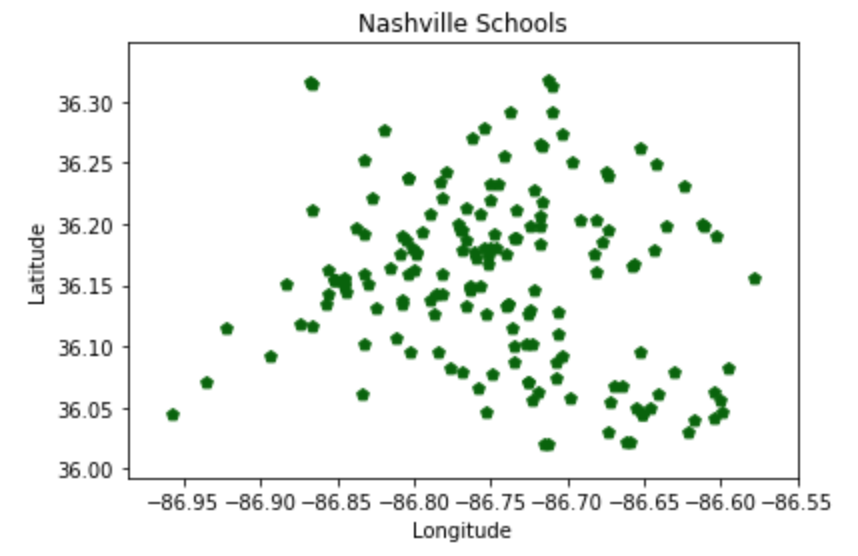
plt.scatter(schools.lng, schools.lat, marker = 'p', c = 'darkgreen')
plt.title('Nashville Schools and School Districts')
plt.show();

plot of Nashville School and School Districts

Visualizing Geospatial Data in Python

Let's practice!

Visualizing Geospatial Data in Python

Preparing Video For Download...