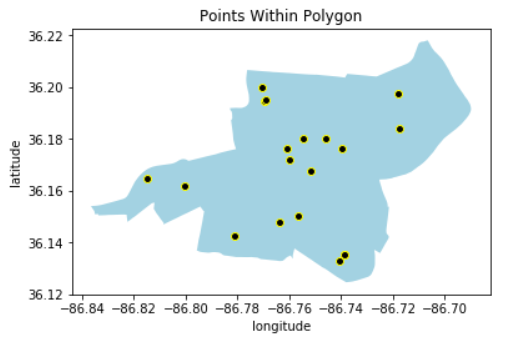
Spatial joins
Visualizing Geospatial Data in Python

Mary van Valkenburg
Data Science Program Manager, Nashville Software School
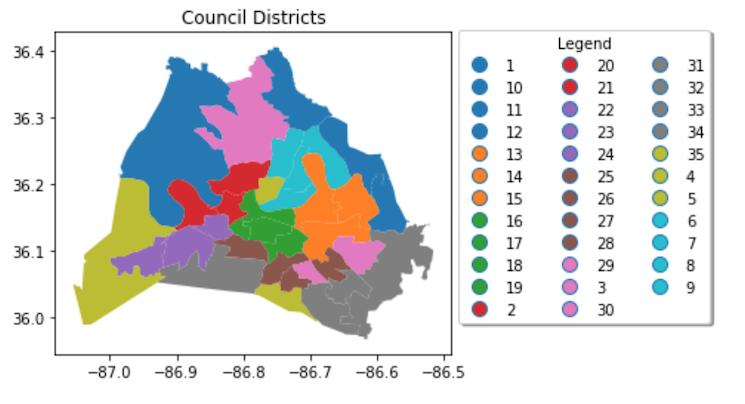
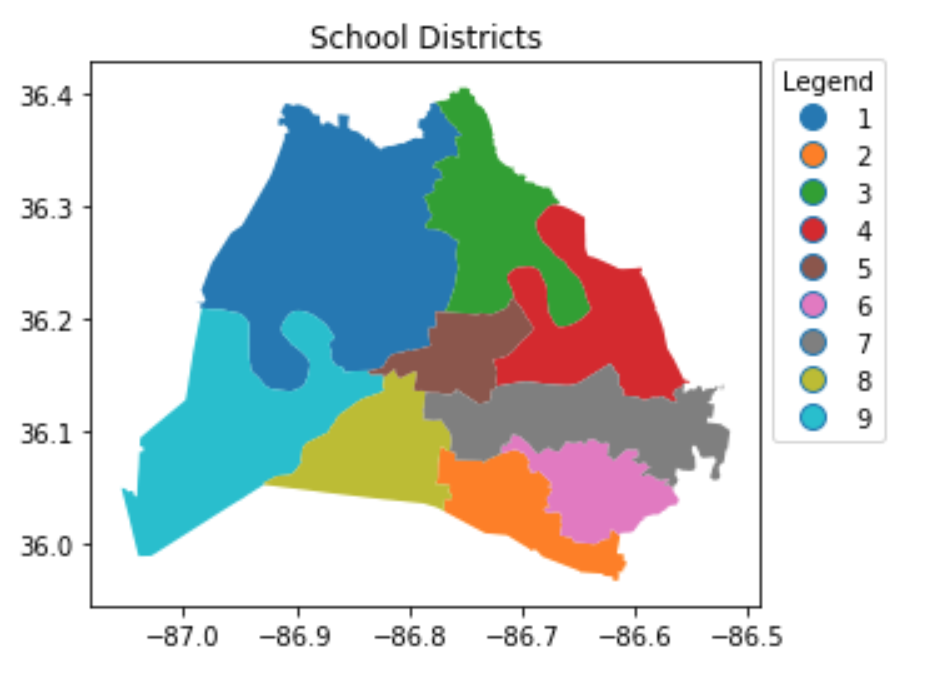
Council districts and school districts
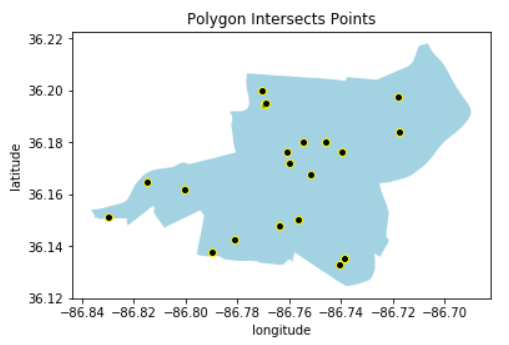
Using .sjoin()
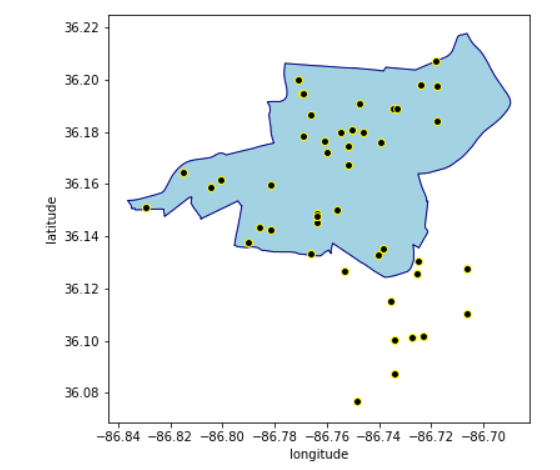
predicate = 'intersects'
gpd.sjoin(blue_region_gdf, black_point_gdf, predicate = 'intersects')
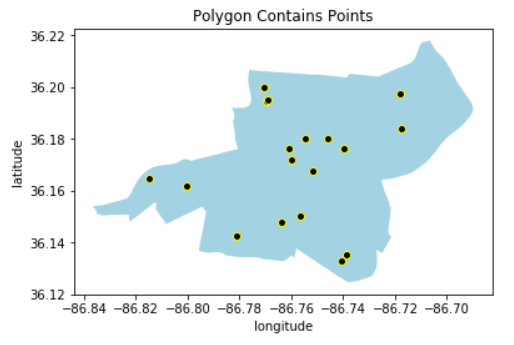
predicate = 'contains'
gpd.sjoin(blue_region_gdf, black_point_gdf, predicate = 'contains')
predicate = 'within'
gpd.sjoin(black_point_gdf, blue_region_gdf, predicate = 'within')