Survival Analysis in R
Heidi Seibold
Statistician at LMU Munich
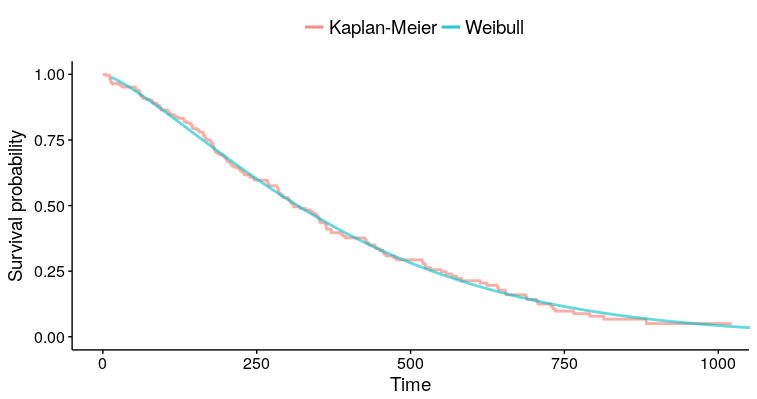
Weibull model:
wb <- survreg(Surv(time, event) ~ 1, data)
Kaplan-Meier estimate:
km <- survfit(Surv(time, event) ~ 1, data)
wb <- survreg(Surv(time, cens) ~ 1, data = GBSG2)
90 Percent of patients survive beyond time point:
predict(wb, type = "quantile", p = 1 - 0.9, newdata = data.frame(1))
       1
384.9947
p = 1 - 0.9 because the distribution function is 1 - the survival function.
p = 1 - 0.9
Survival curve:
surv <- seq(.99, .01, by = -.01)

t <- predict(wb, type = "quantile", p = 1 - surv, newdata = data.frame(1))
head(data.frame(time = t, surv = surv))
surv <- seq(.99, .01, by = -.01)
t <- predict(wb, type = "quantile", p = 1 - surv, newdata = data.frame(1)) head(data.frame(time = t, surv = surv))
       time surv
 1  60.6560 0.99
 2 105.0392 0.98
 3 145.0723 0.97
 4 182.6430 0.96
 5 218.5715 0.95
 6 253.3125 0.94