Image data
Biomedical Image Analysis in Python

Stephen Bailey
Instructor
Biomedical imaging: more than a century of discovery
$$1895$$
![By Wilhelm Röntgen. - [1], Public Domain, https://commons.wikimedia.org/w/index.php?curid=5059748](https://assets.datacamp.com/production/repositories/2085/datasets/da638d73b243da7542e3ee94692e08884c19eb6b/Ch1_L1_First-XRay.gif)
$$2017$$
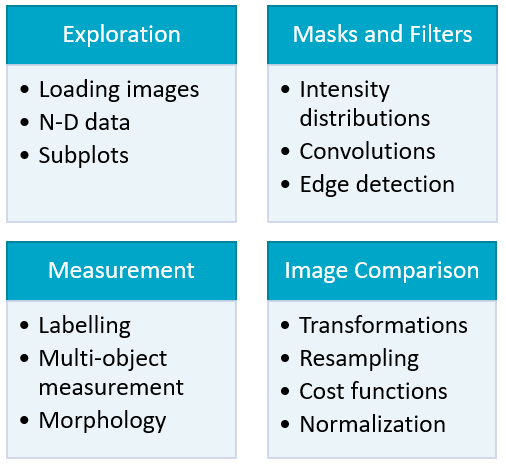
Course objectives
Plotting images
import matplotlib.pyplot as pltplt.imshow(im, cmap='gray')plt.axis('off')plt.show()