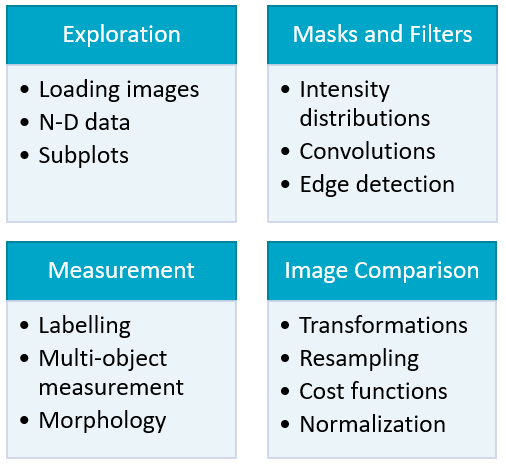
Normalizing measurements
Biomedical Image Analysis in Python

Stephen Bailey
Instructor
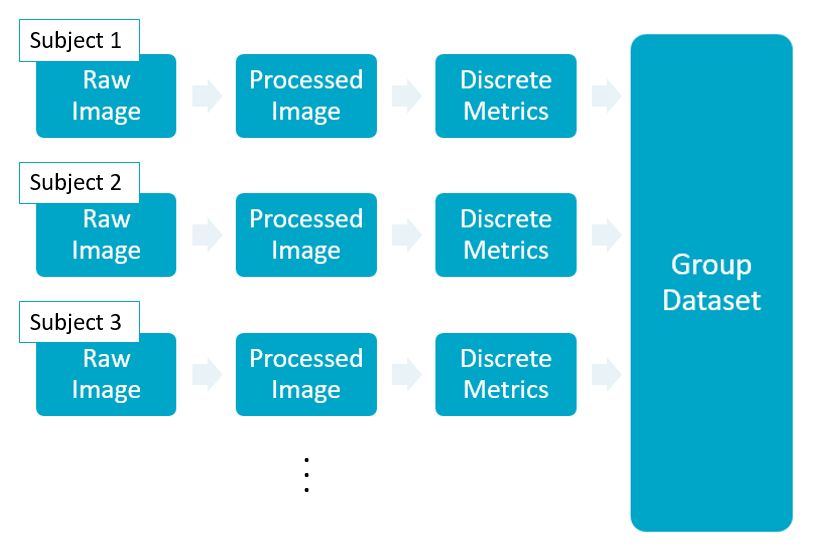
Analysis workflow
Hypothesis testing

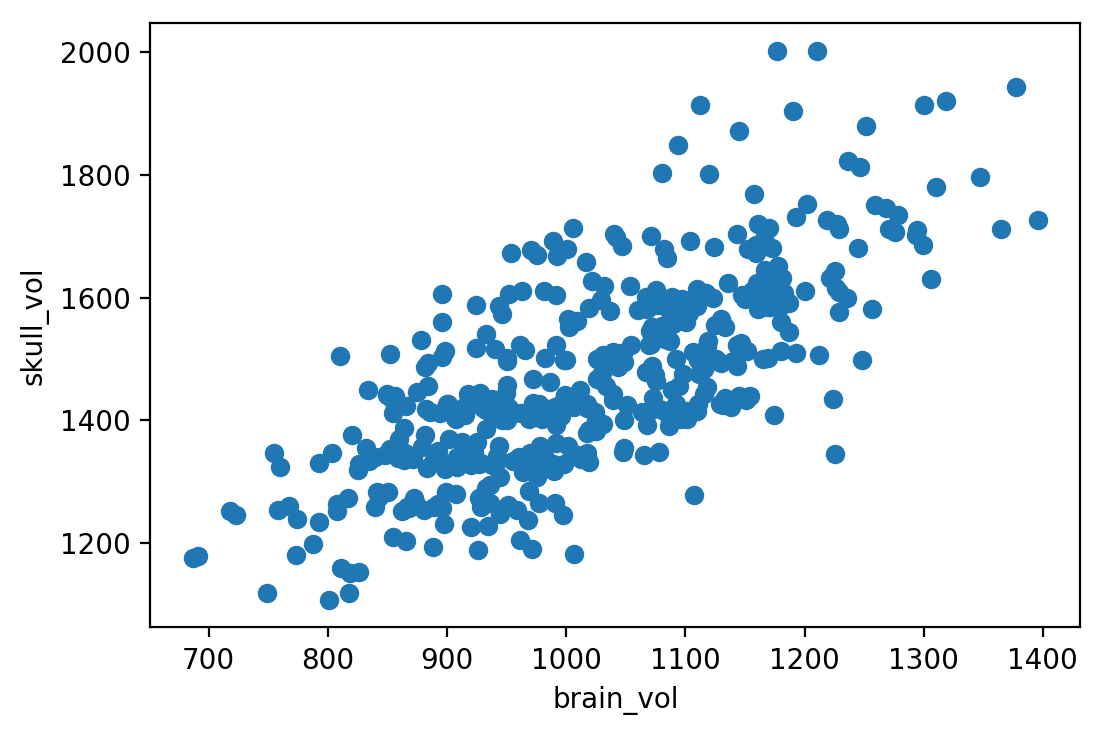
Correlated measurements
df[['brain_vol', 'skull_vol']].corr()
                'brain_vol' 'skull_vol'
    'brain_vol'      1.000       0.736
    'skull_vol'      0.736       1.000
Congratulations!