Measuring Intensity
Biomedical Image Analysis in Python

Stephen Bailey
Instructor
Measuring intensity
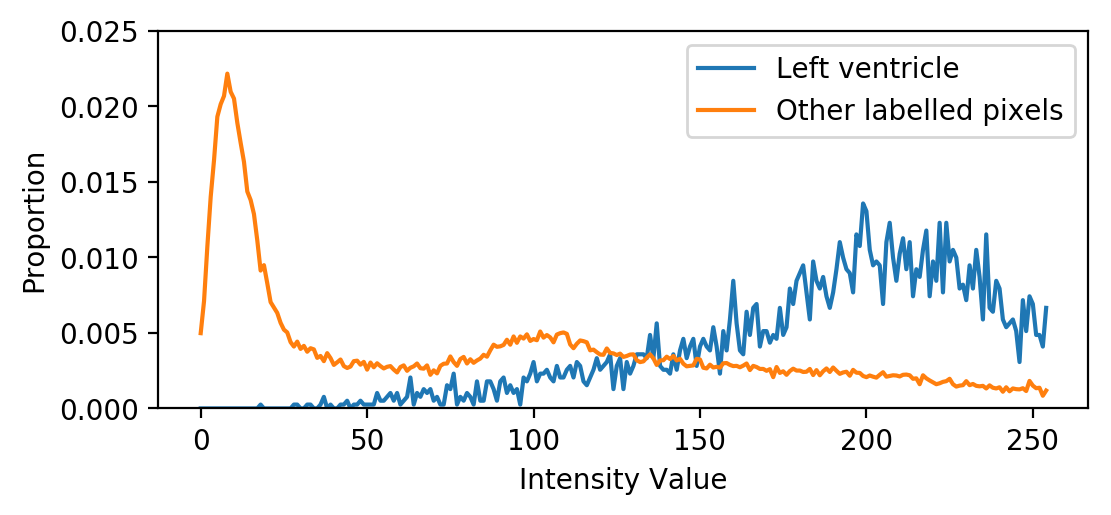
Object histograms
plt.plot(obj_hists[0],
   label='Left ventricle')
plt.plot(obj_hists[1],
   label='Other labelled pixels')
plt.legend()
plt.show()