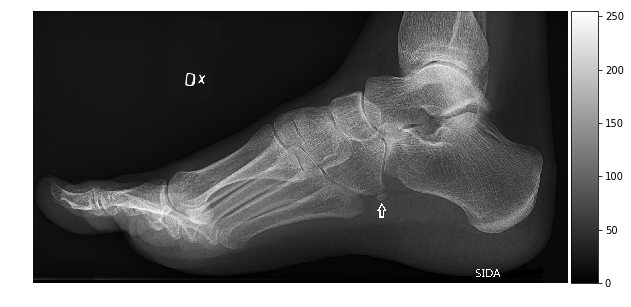
Intensity Values
Biomedical Image Analysis in Python

Stephen Bailey
Instructor
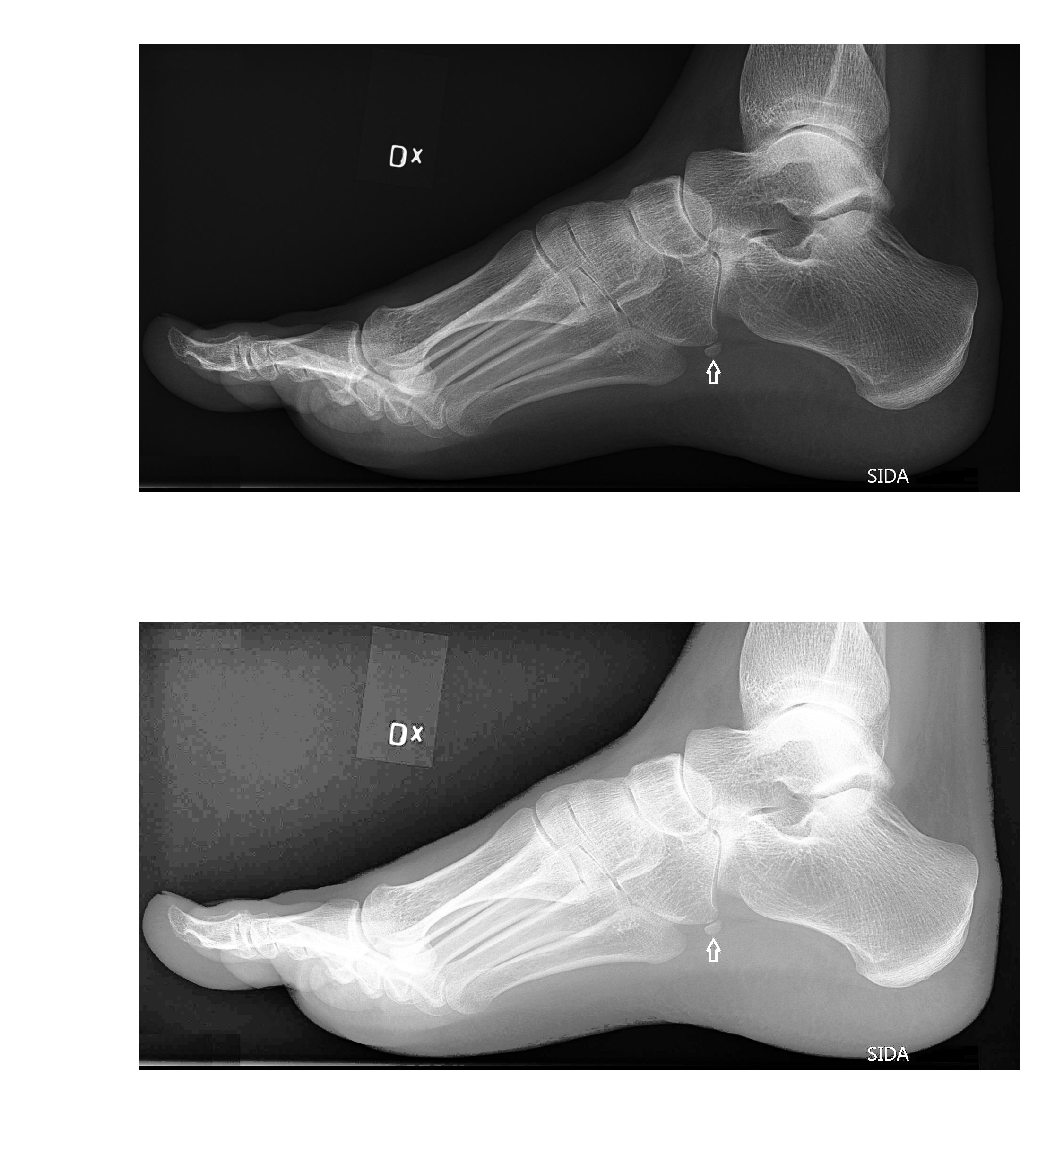
Pixels and voxels
- Pixels are 2D picture elements
- Voxels are 3D volume elements
- Two properties: intensity and location
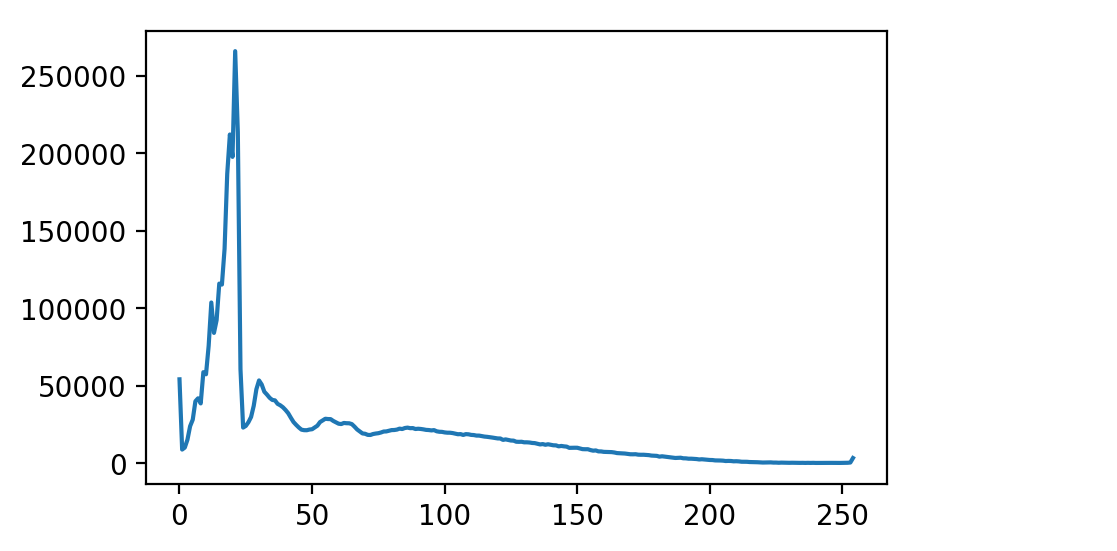
Histograms
import scipy.ndimage as ndihist=ndi.histogram(im, min=0, max=255, bins=256)hist.shape
(256,)
Equalization
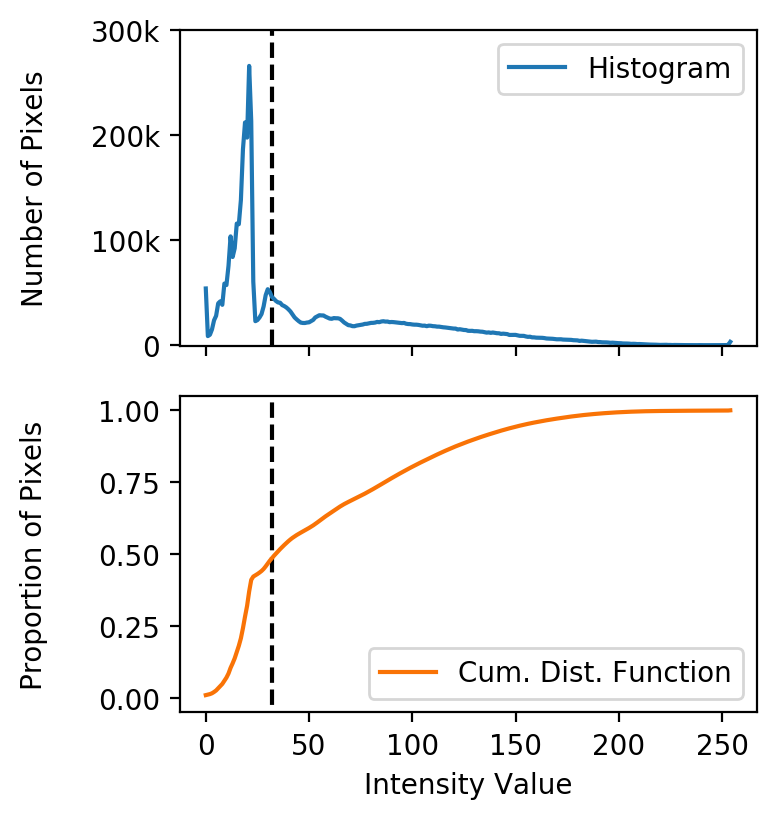
Equalization