Selection strategies
Intermediate Interactive Data Visualization with plotly in R

Adam Loy
Statistician, Carleton College
Two selection strategies
Example
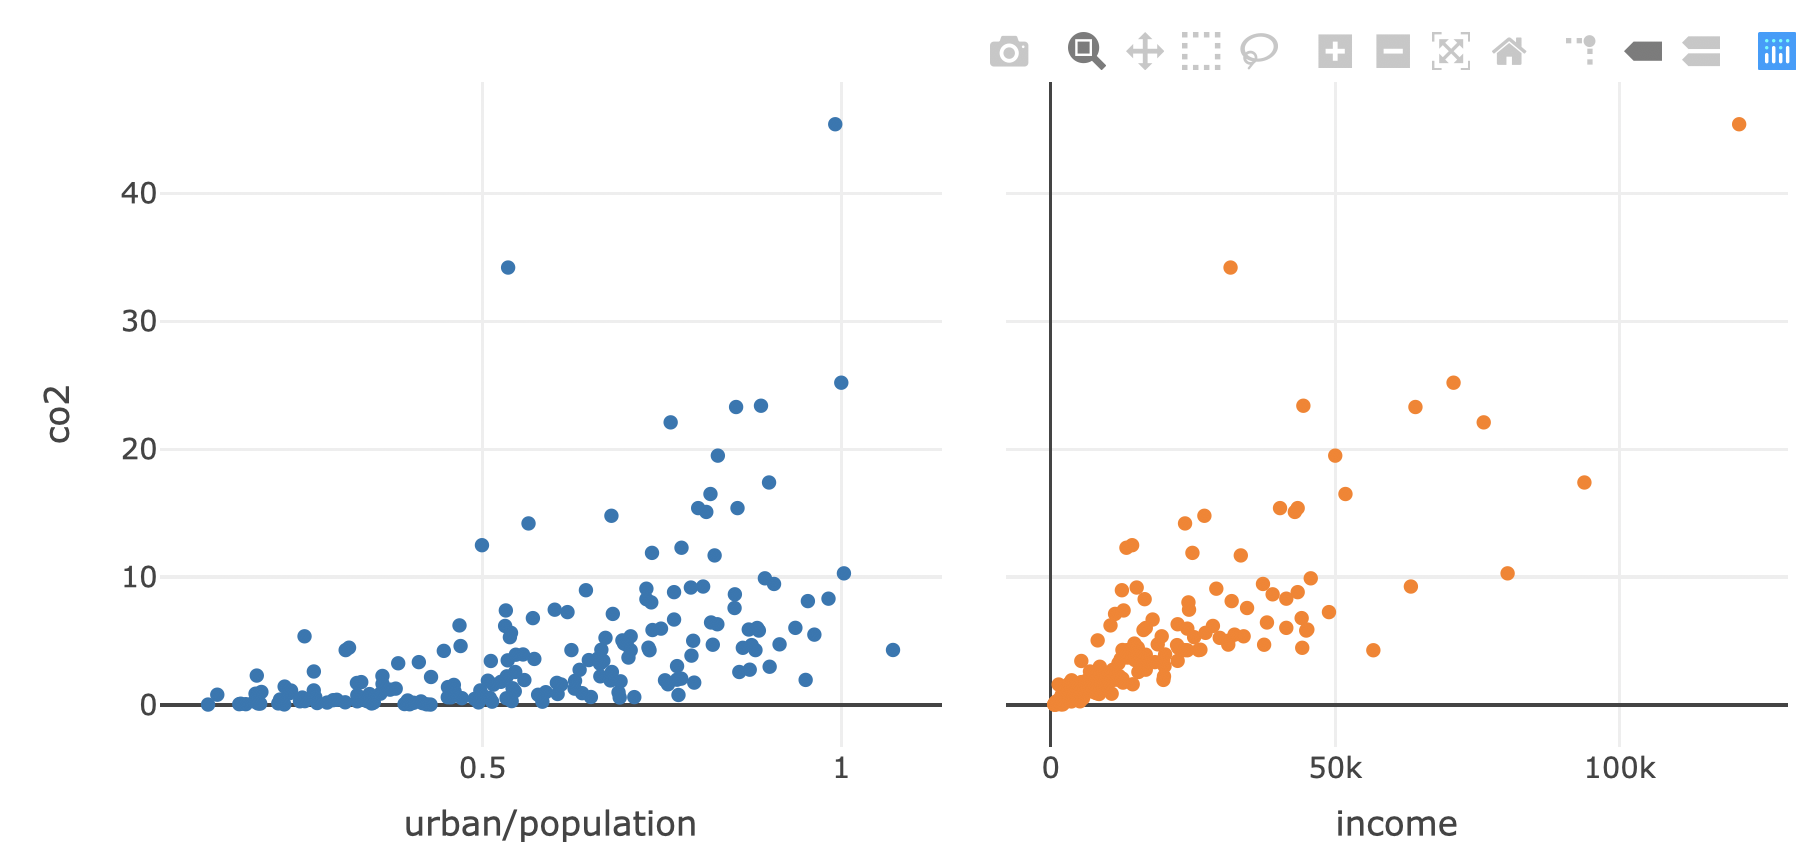
Persistent selection
Activate persistent selection via highlight()
subplot(p1, p2, titleX = TRUE, shareY = TRUE) %>%
  hide_legend() %>%
  highlight(persistent = TRUE)
Highlighting in color
Two manipulation types