Cumulative Animations
Intermediate Interactive Data Visualization with plotly in R

Adam Loy
Statistician, Carleton College
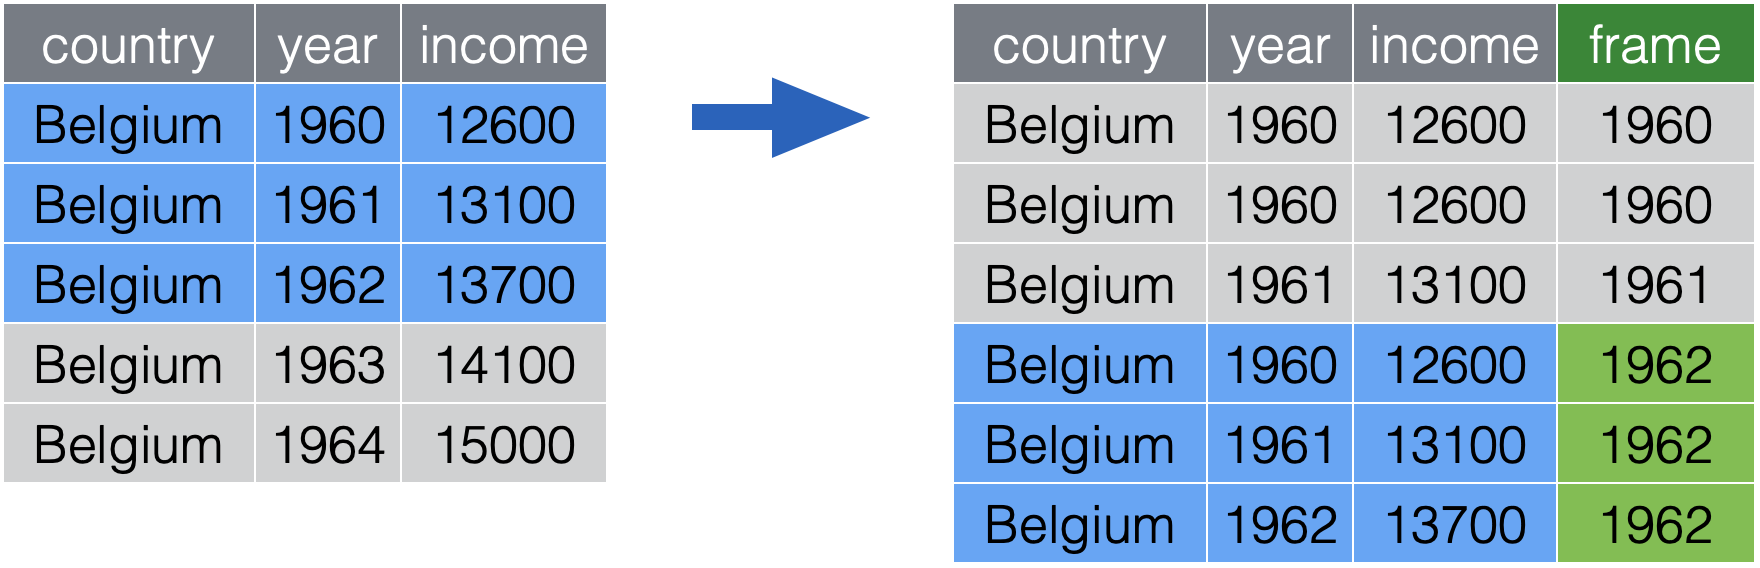
What's the frame?
Goal
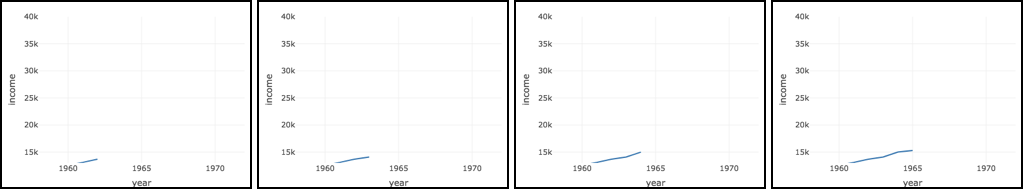
frame = ~year 
Accumulating data sets

Accumulating data sets
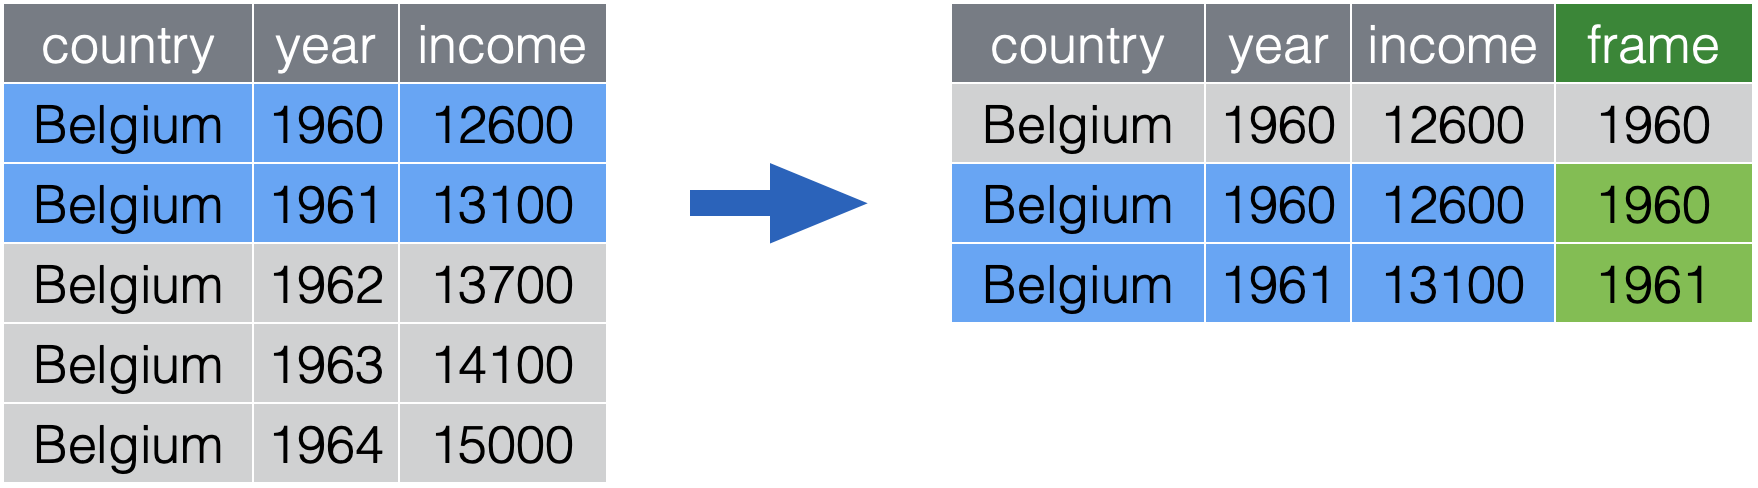
Accumulating data sets
split()

accumulate()
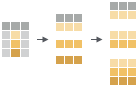
name
combine
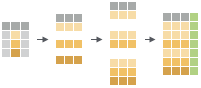
animate