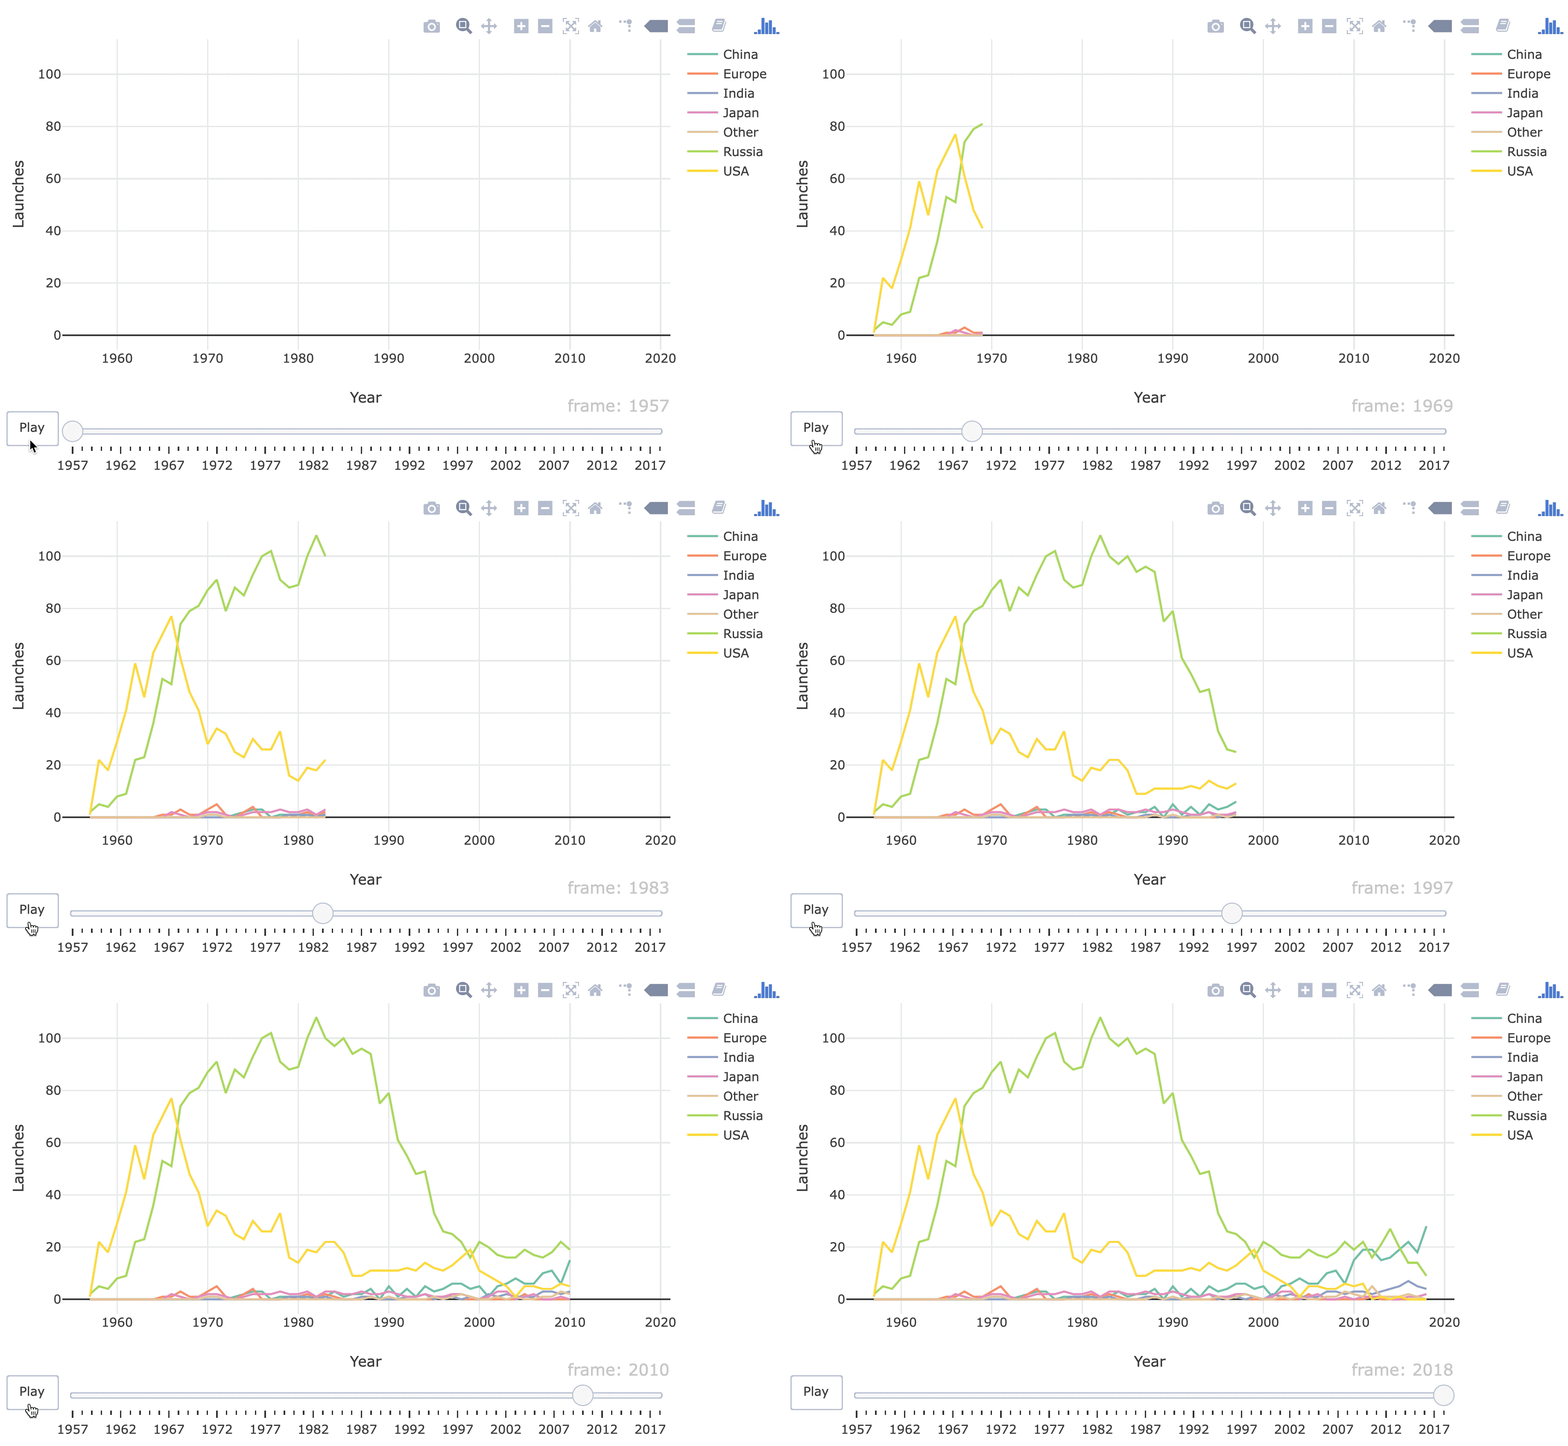
Introduction to the space launches data
Intermediate Interactive Data Visualization with plotly in R

Adam Loy
Statistician, Carleton College
Launches data set

Image credit: Airforce Space Command, 45th Space Wing Public Affairs
Data source: https://github.com/rfordatascience/tidytuesday
Launches data set
dplyr::glimpse(launches)
Rows: 5,726
Columns: 11
$ tag         <chr> "1967-065", "1967-080", "1967-096", "1968-042", …
$ JD          <dbl> 2439671, 2439726, 2439775, 2440000, 2440153, 244…
$ launch_date <date> 1967-06-29, 1967-08-23, 1967-10-11, 1968-05-23,…
$ launch_year <dbl> 1967, 1967, 1967, 1968, 1968, 1969, 1970, 1970, …
$ type        <chr> "Thor Burner 2", "Thor Burner 2", "Thor Burner 2"…
$ variant     <chr> NA, NA, NA, NA, NA, NA, NA, NA, NA, NA, NA, NA, …
$ mission     <chr> "Secor Type II S/N 10", "DAPP 3419", "DAPP 4417"…
$ agency      <chr> "US", "US", "US", "US", "US", "US", "US", "US", …
$ state_code  <chr> "US", "US", "US", "US", "US", "US", "US", "US", …
$ category    <chr> "O", "O", "O", "O", "O", "O", "O", "O", "O", "O"…
$ agency_type <chr> "state", "state", "state", "state", "state", "state"…
Variables
| variable | definition |
|---|---|
| launch_year | year of launch |
| agency | launching agency |
| state_code | launching agency's state |
| category | success (O) or failure (F) |
| agency_type | type of agency |
| variable | definition |
|---|---|
| tag | Harvard or COSPAR id of launch |
| JD | Julian Date of launch |
| launch_date | date of launch |
| type | type of launch vehicle |
| variant | variant of launch vehicle |
| mission | mission name |
Exploring the space race

R package downloads

CRAN download logs
dplyr::glimpse(monthly_logs)
Rows: 171
Columns: 4
$ package   <chr> "ggvis", "ggvis", "ggvis", "ggvis", "ggvis", "ggvis",…
$ date      <date> 2014-06-30, 2014-07-31, 2014-08-31, 2014-09-30, 2014…
$ dec_date  <dbl> 2014.49, 2014.58, 2014.66, 2014.75, 2014.83, 2014.91,…
$ downloads <dbl> 1344, 2120, 2035, 1702, 3590, 2899, 2427, 2227, 2708,…
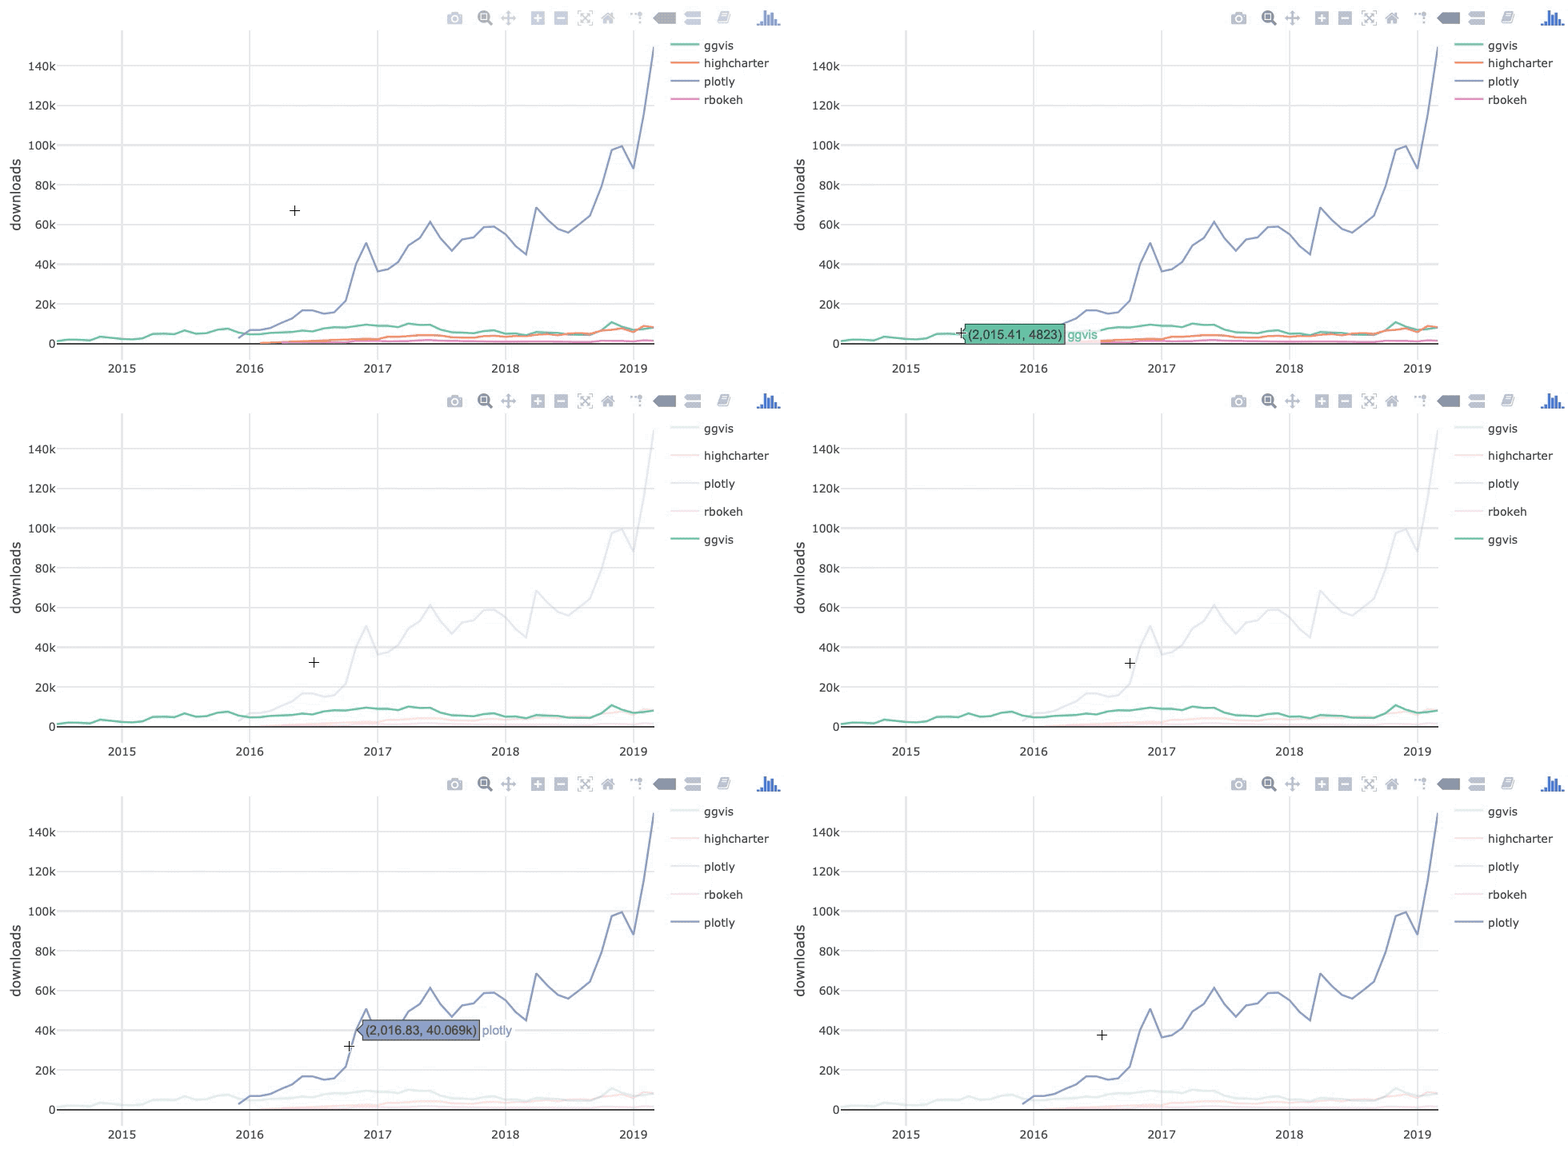
Grouped brushing
shared_logs <- monthly_logs %>% SharedData$new(key = ~package)shared_logs %>% plot_ly(x = ~dec_date, y = ~downloads, color = ~package) %>% add_lines() %>% highlight()
Let's practice!
Intermediate Interactive Data Visualization with plotly in R

