Moving Beyond Simple Interactivity
Intermediate Interactive Data Visualization with plotly in R

Adam Loy
Statistician, Carleton College
Country-level economic indicators
Source: gapminder.org
world_indicators
# A tibble: 11,387 x 11
  country  year income     co2 military population  urban life_expectancy four_regions
  <chr>   <dbl>  <dbl>   <dbl>    <dbl>      <dbl>  <dbl>           <dbl> <chr>
1 Afghan…  1960   1210  0.0461       NA    9000000 7.56e5            38.6 asia
2 Albania  1960   2790  1.24         NA    1640000 4.94e5            62.7 europe
3 Algeria  1960   6520  0.554        NA   11100000 3.39e6            52   africa
4 Andorra  1960  15200 NA            NA      13400 7.84e3            NA   europe
5 Angola   1960   3860  0.0975       NA    5640000 5.89e5            42.4 africa
# … with 1.138e+04 more rows, and 2 more variables: eight_regions <chr>, six_regions <chr>
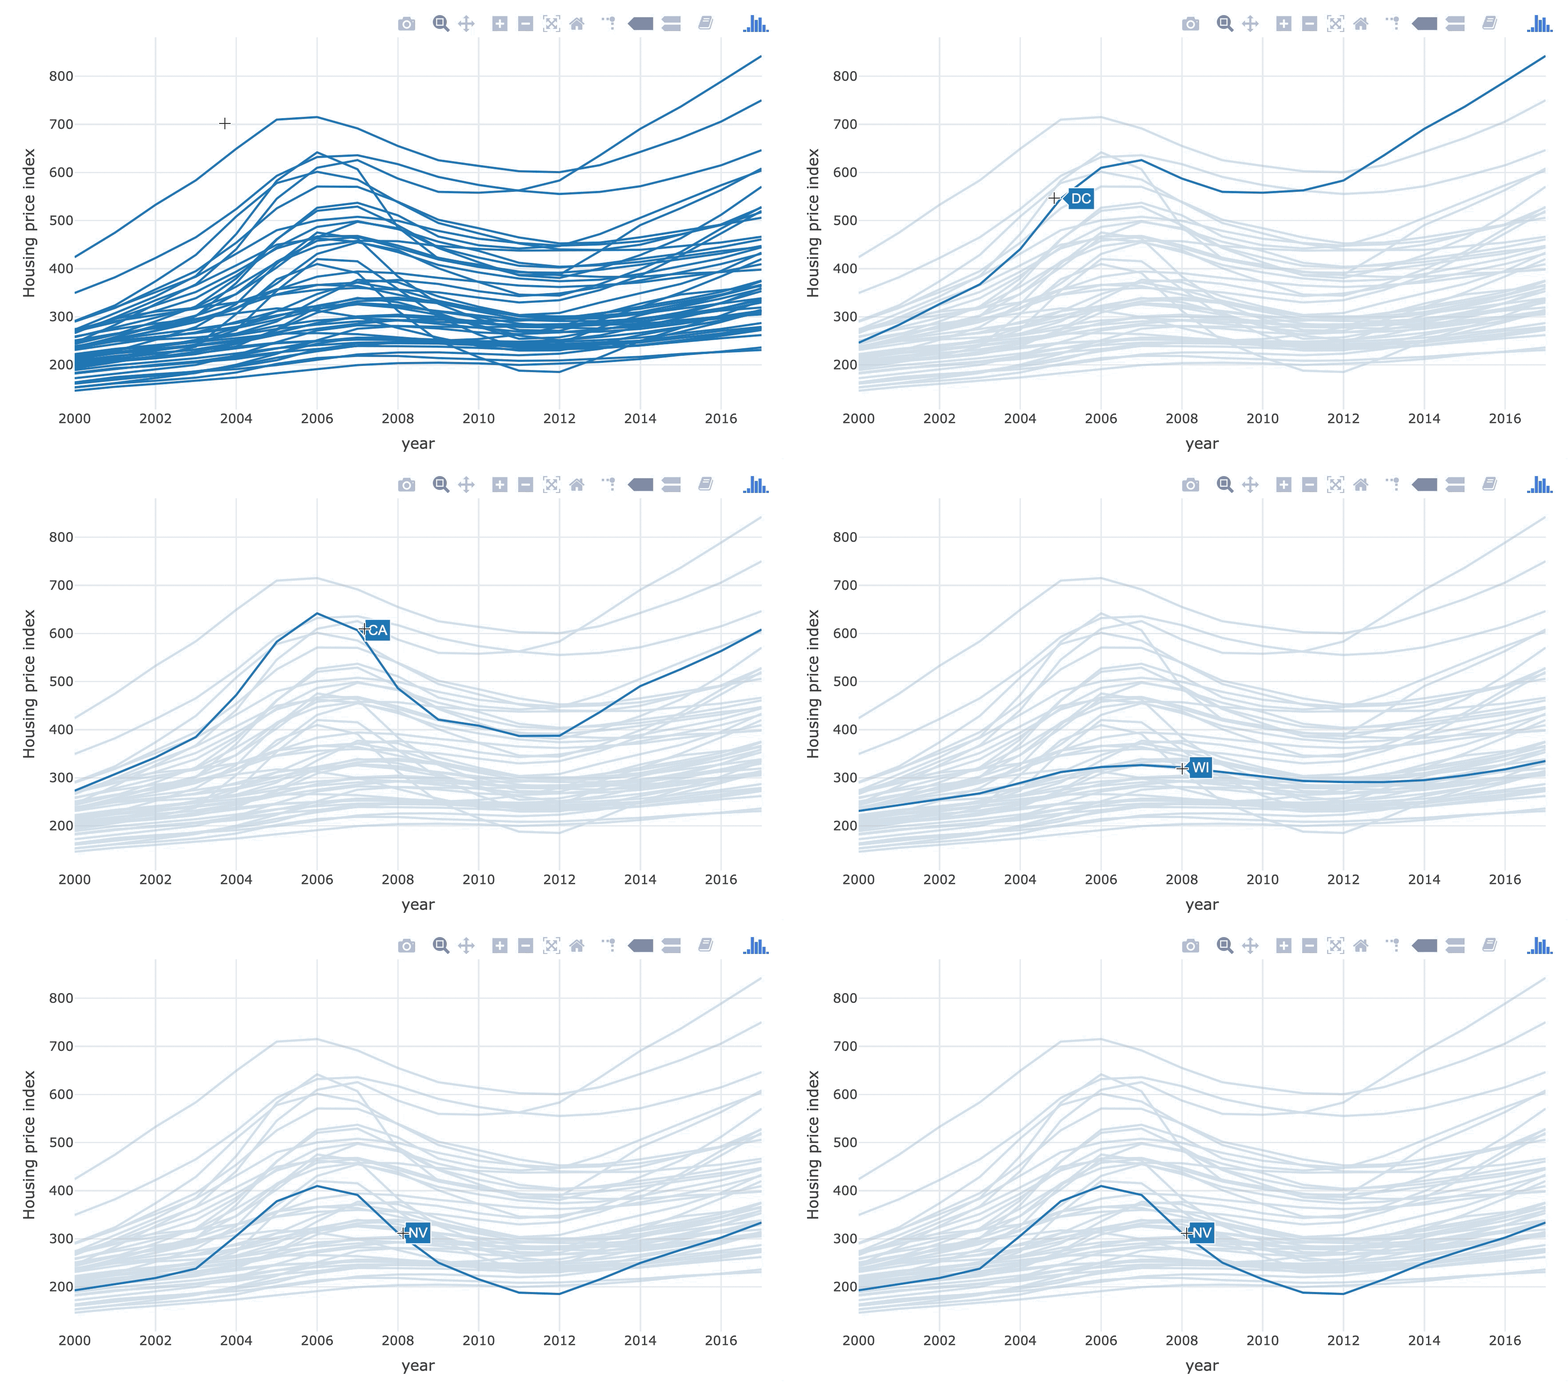
State-level economic data
us_economy
# A tibble: 1,071 x 9
  state  year    gdp employment home_owners house_price population region division
  <chr> <dbl>  <dbl>      <dbl>       <dbl>       <dbl>      <dbl> <chr>  <chr>
1 AK     1997 42262.         NA        67.2        159.       609. West   Pacific
2 AK     1998 41157.         NA        66.3        164.       615. West   Pacific
3 AK     1999 40722.         NA        66.4        169.       620. West   Pacific
4 AK     2000 39517.         NA        66.4        172.       628. West   Pacific
5 AK     2001 40974.         NA        65.3        181.       634. West   Pacific
# … with 1,066 more rows

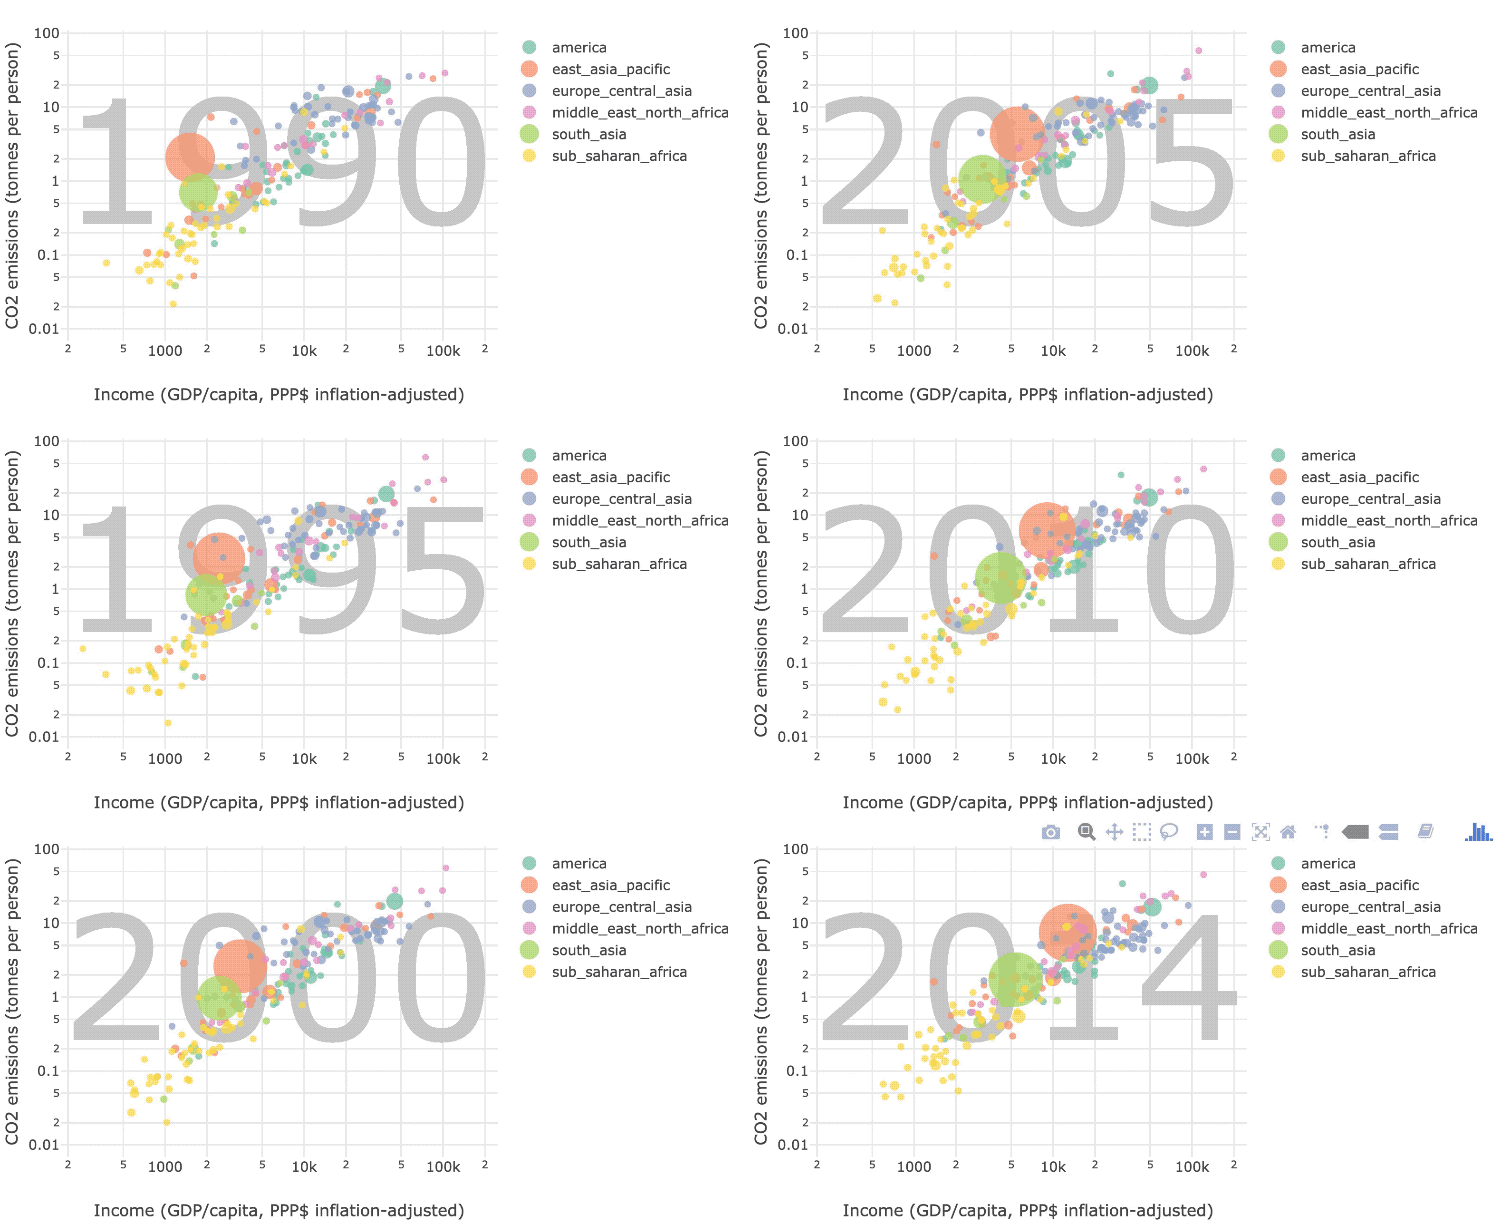
Static bubble charts
world_indicators %>%
   filter(year == 2014) %>%
   plot_ly(
     x = ~income, y = ~co2, hoverinfo = "text",
     text = ~country
   ) %>%
   add_markers(
      size = ~population, color = ~six_regions,
      marker = list(opacity = 0.5,
                    sizemode = "diameter",
                    sizeref = 2)
   )
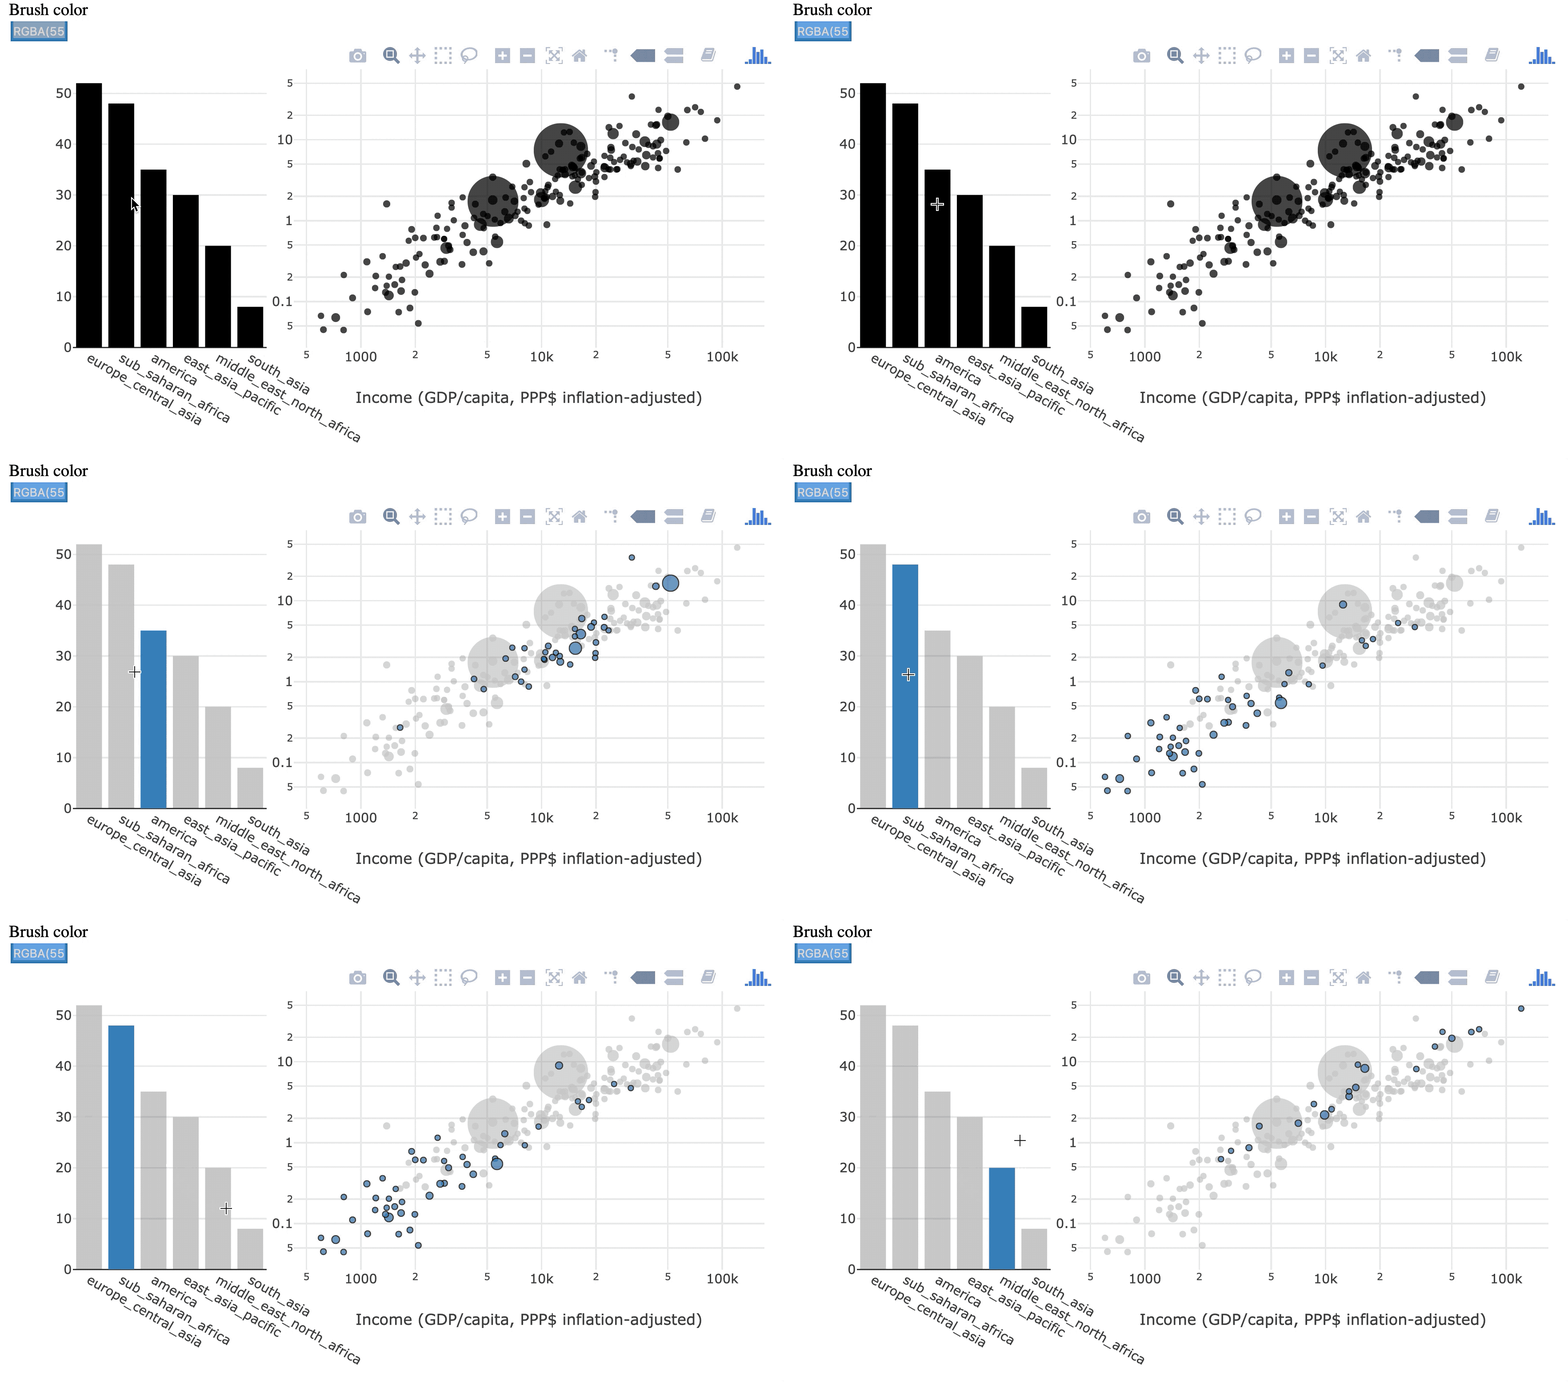
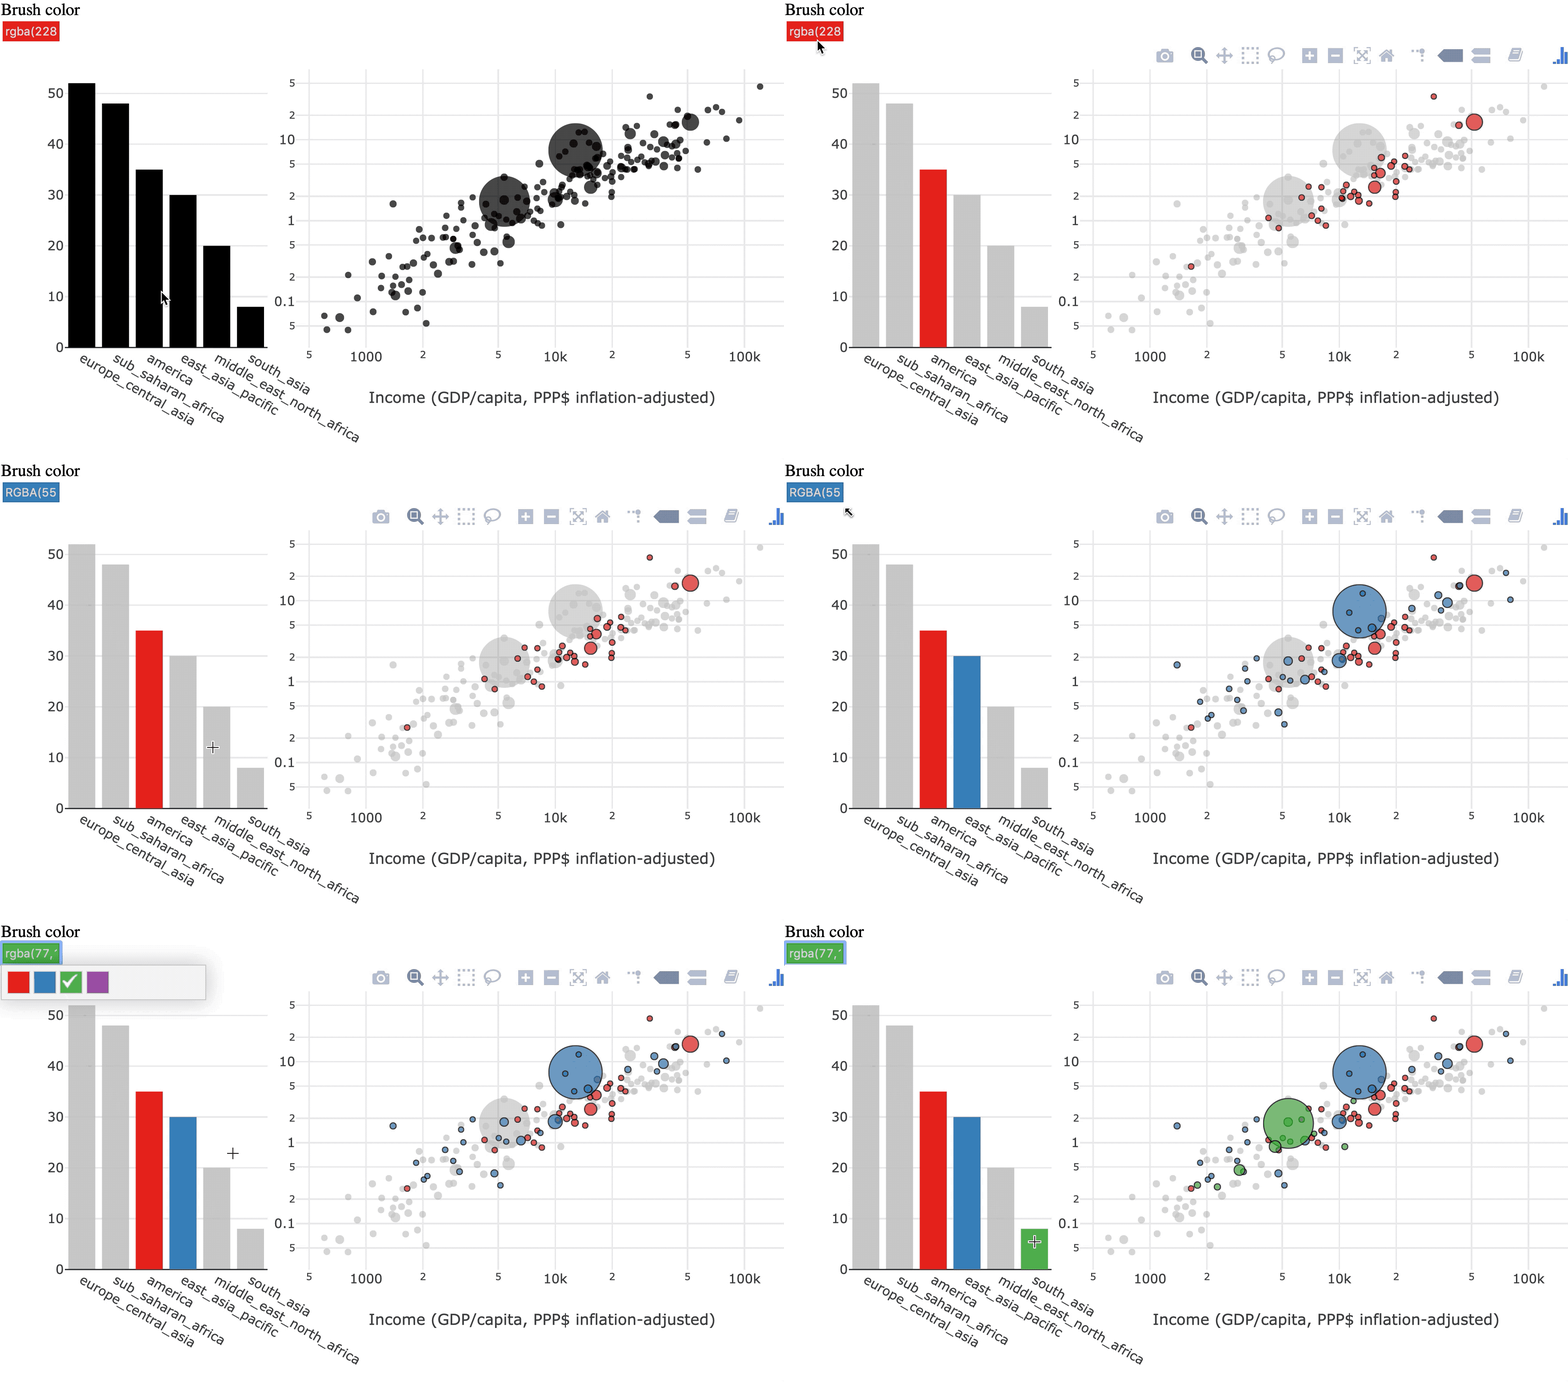
Linked brushing


Let's explore!
Intermediate Interactive Data Visualization with plotly in R

