Polishing animations
Intermediate Interactive Data Visualization with plotly in R

Adam Loy
Statistician, Carleton College
Animation options

Animation options
Speeding up
Pausing between frames
Bouncing points

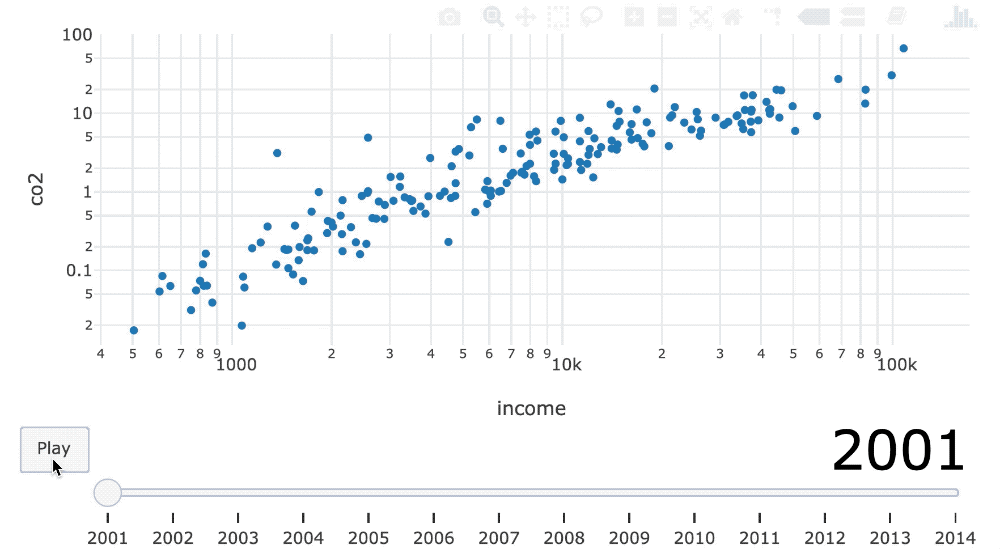
Slider options
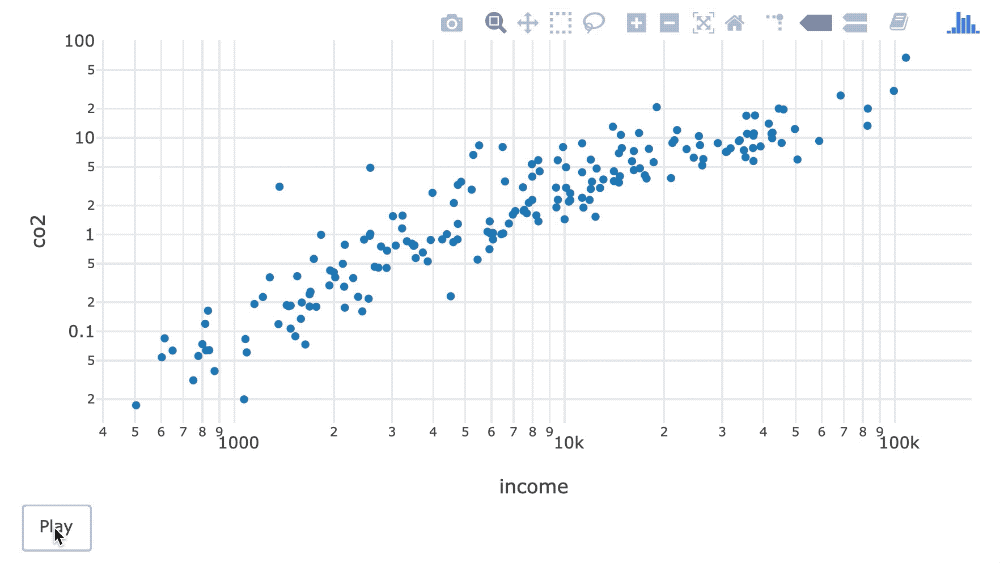
Removing the slider
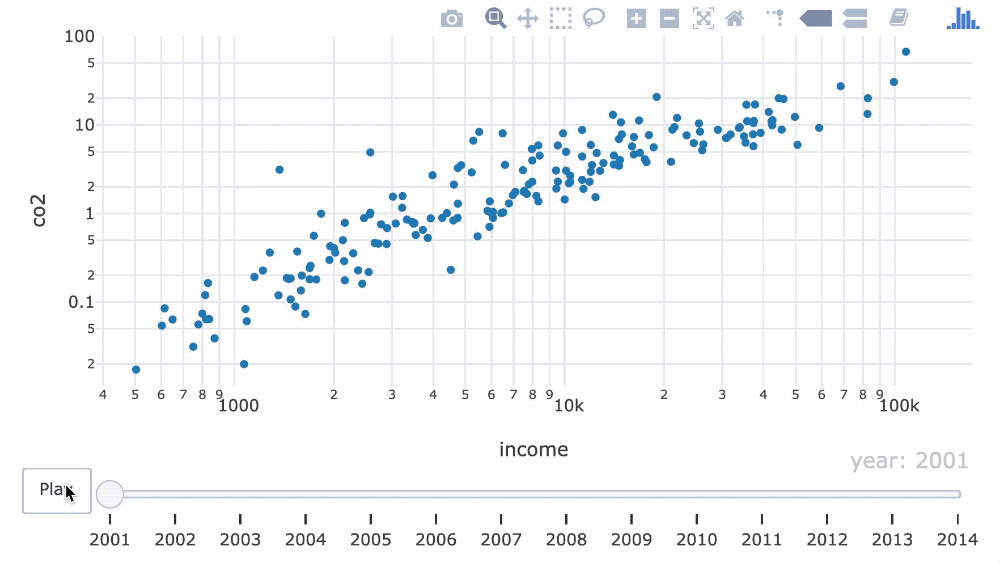
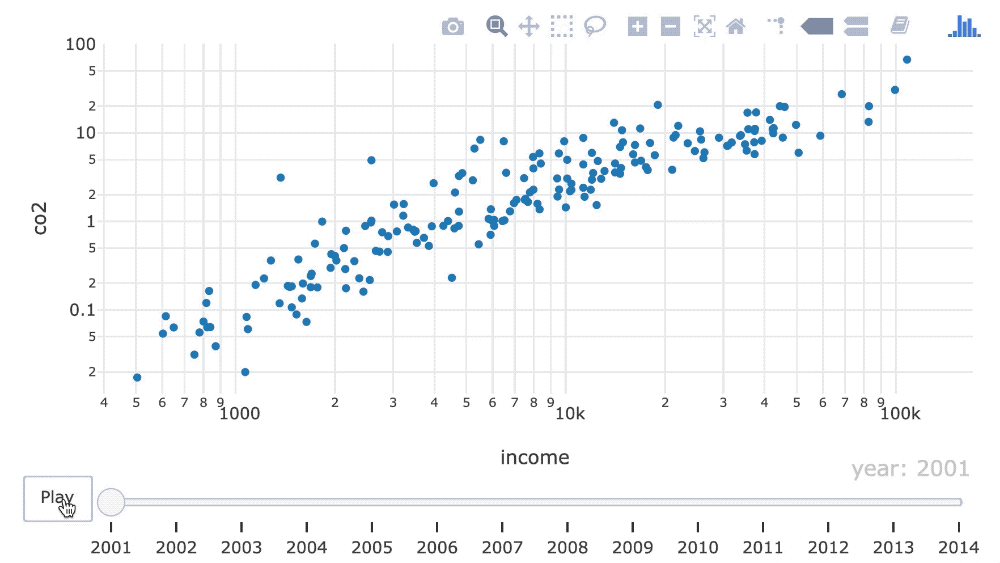
Editing slider text
Editing slider text