Wrap-up

Intermediate Interactive Data Visualization with plotly in R

Adam Loy

Statistician, Carleton College

Chapter 1: plotly review

bubble2014.png

  • Changing marker color, size, and symbols

  • Polishing the layout() to provide context

Intermediate Interactive Data Visualization with plotly in R

Chapter 2: Animating your charts

21-object-constancy-fixed.gif

Animation using easing = "bounce".

23-polished.gif

Animation of per capita income in Belgium over time.

Intermediate Interactive Data Visualization with plotly in R

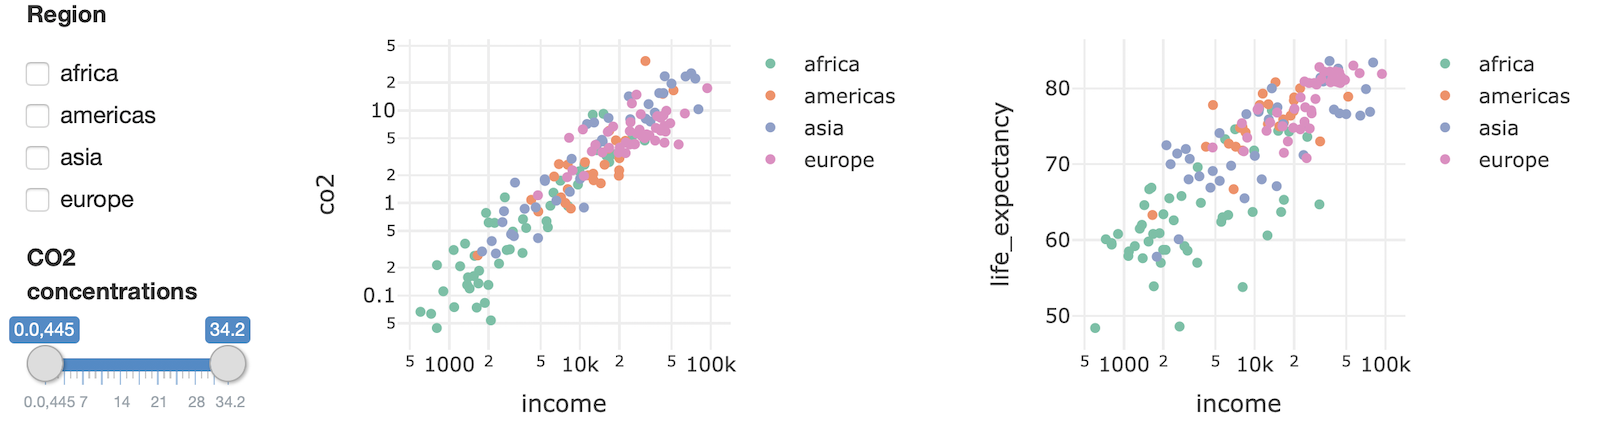
Chapter 3: Linked views and shinier charts

crosstalk::SharedData$new()

linked_brushing.gif

Selection

  • Persistent vs. transient
  • Direct vs. indirect

crosstalk::bscols()

bscols_result_static.png

Intermediate Interactive Data Visualization with plotly in R

Chapter 4: Space launches case study

space_race_states.gif

Intermediate Interactive Data Visualization with plotly in R

Where to go from here

Explore more interactive plotting libraries

Learn Shiny

Intermediate Interactive Data Visualization with plotly in R

Thank you!

Intermediate Interactive Data Visualization with plotly in R

Preparing Video For Download...