Tidy your models with broom
Machine Learning in the Tidyverse

Dmitriy (Dima) Gorenshteyn
Lead Data Scientist, Memorial Sloan Kettering Cancer Center
List Column Workflow
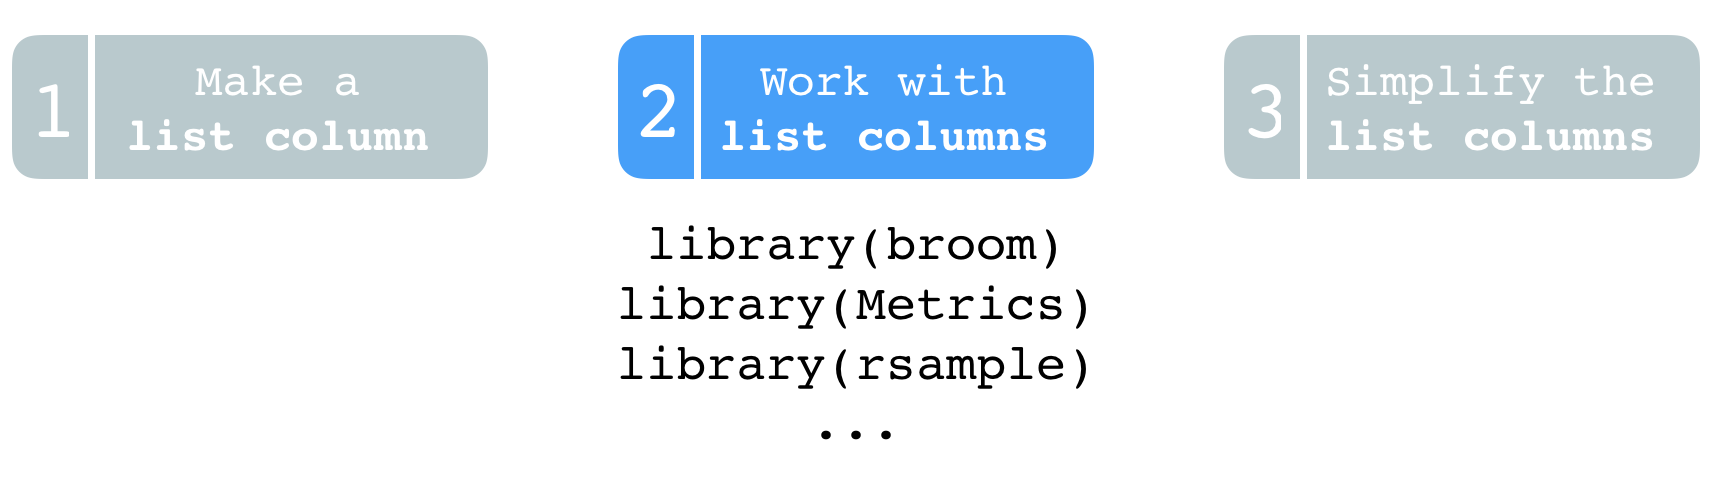
List Column Workflow

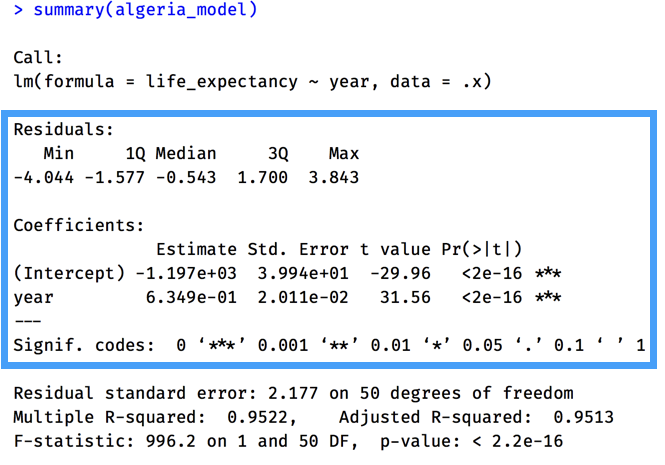
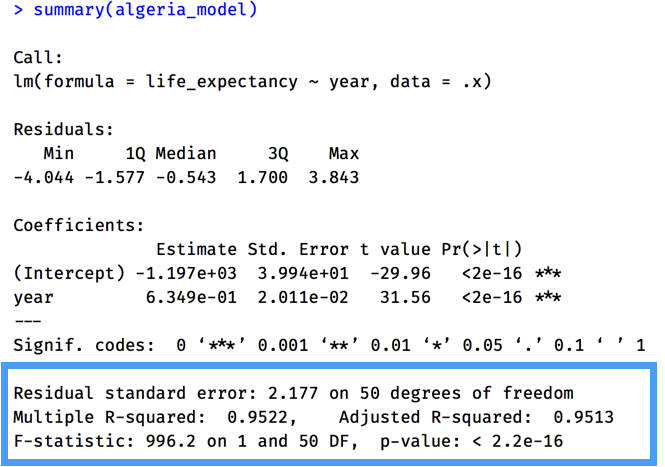
Summary of algeria_model
![]()
tidy()
glance()
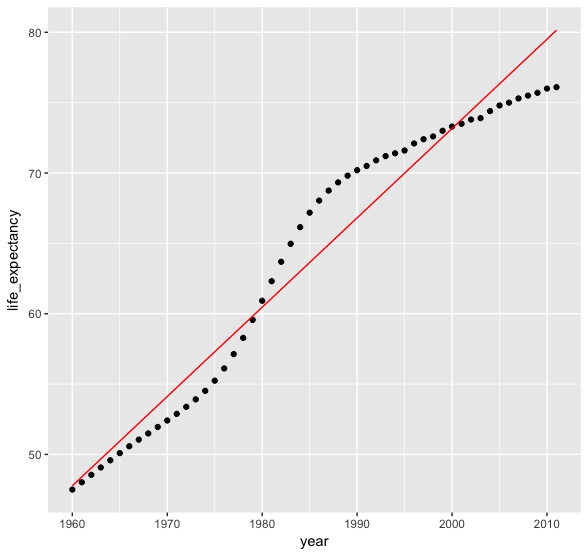
Plotting Augmented Data
augment(algeria_model) %>%
  ggplot(mapping = aes(x = year)) +
  geom_point(mapping = aes(y = life_expectancy)) +
  geom_line(mapping = aes(y = .fitted), color = "red")