library(igraph);
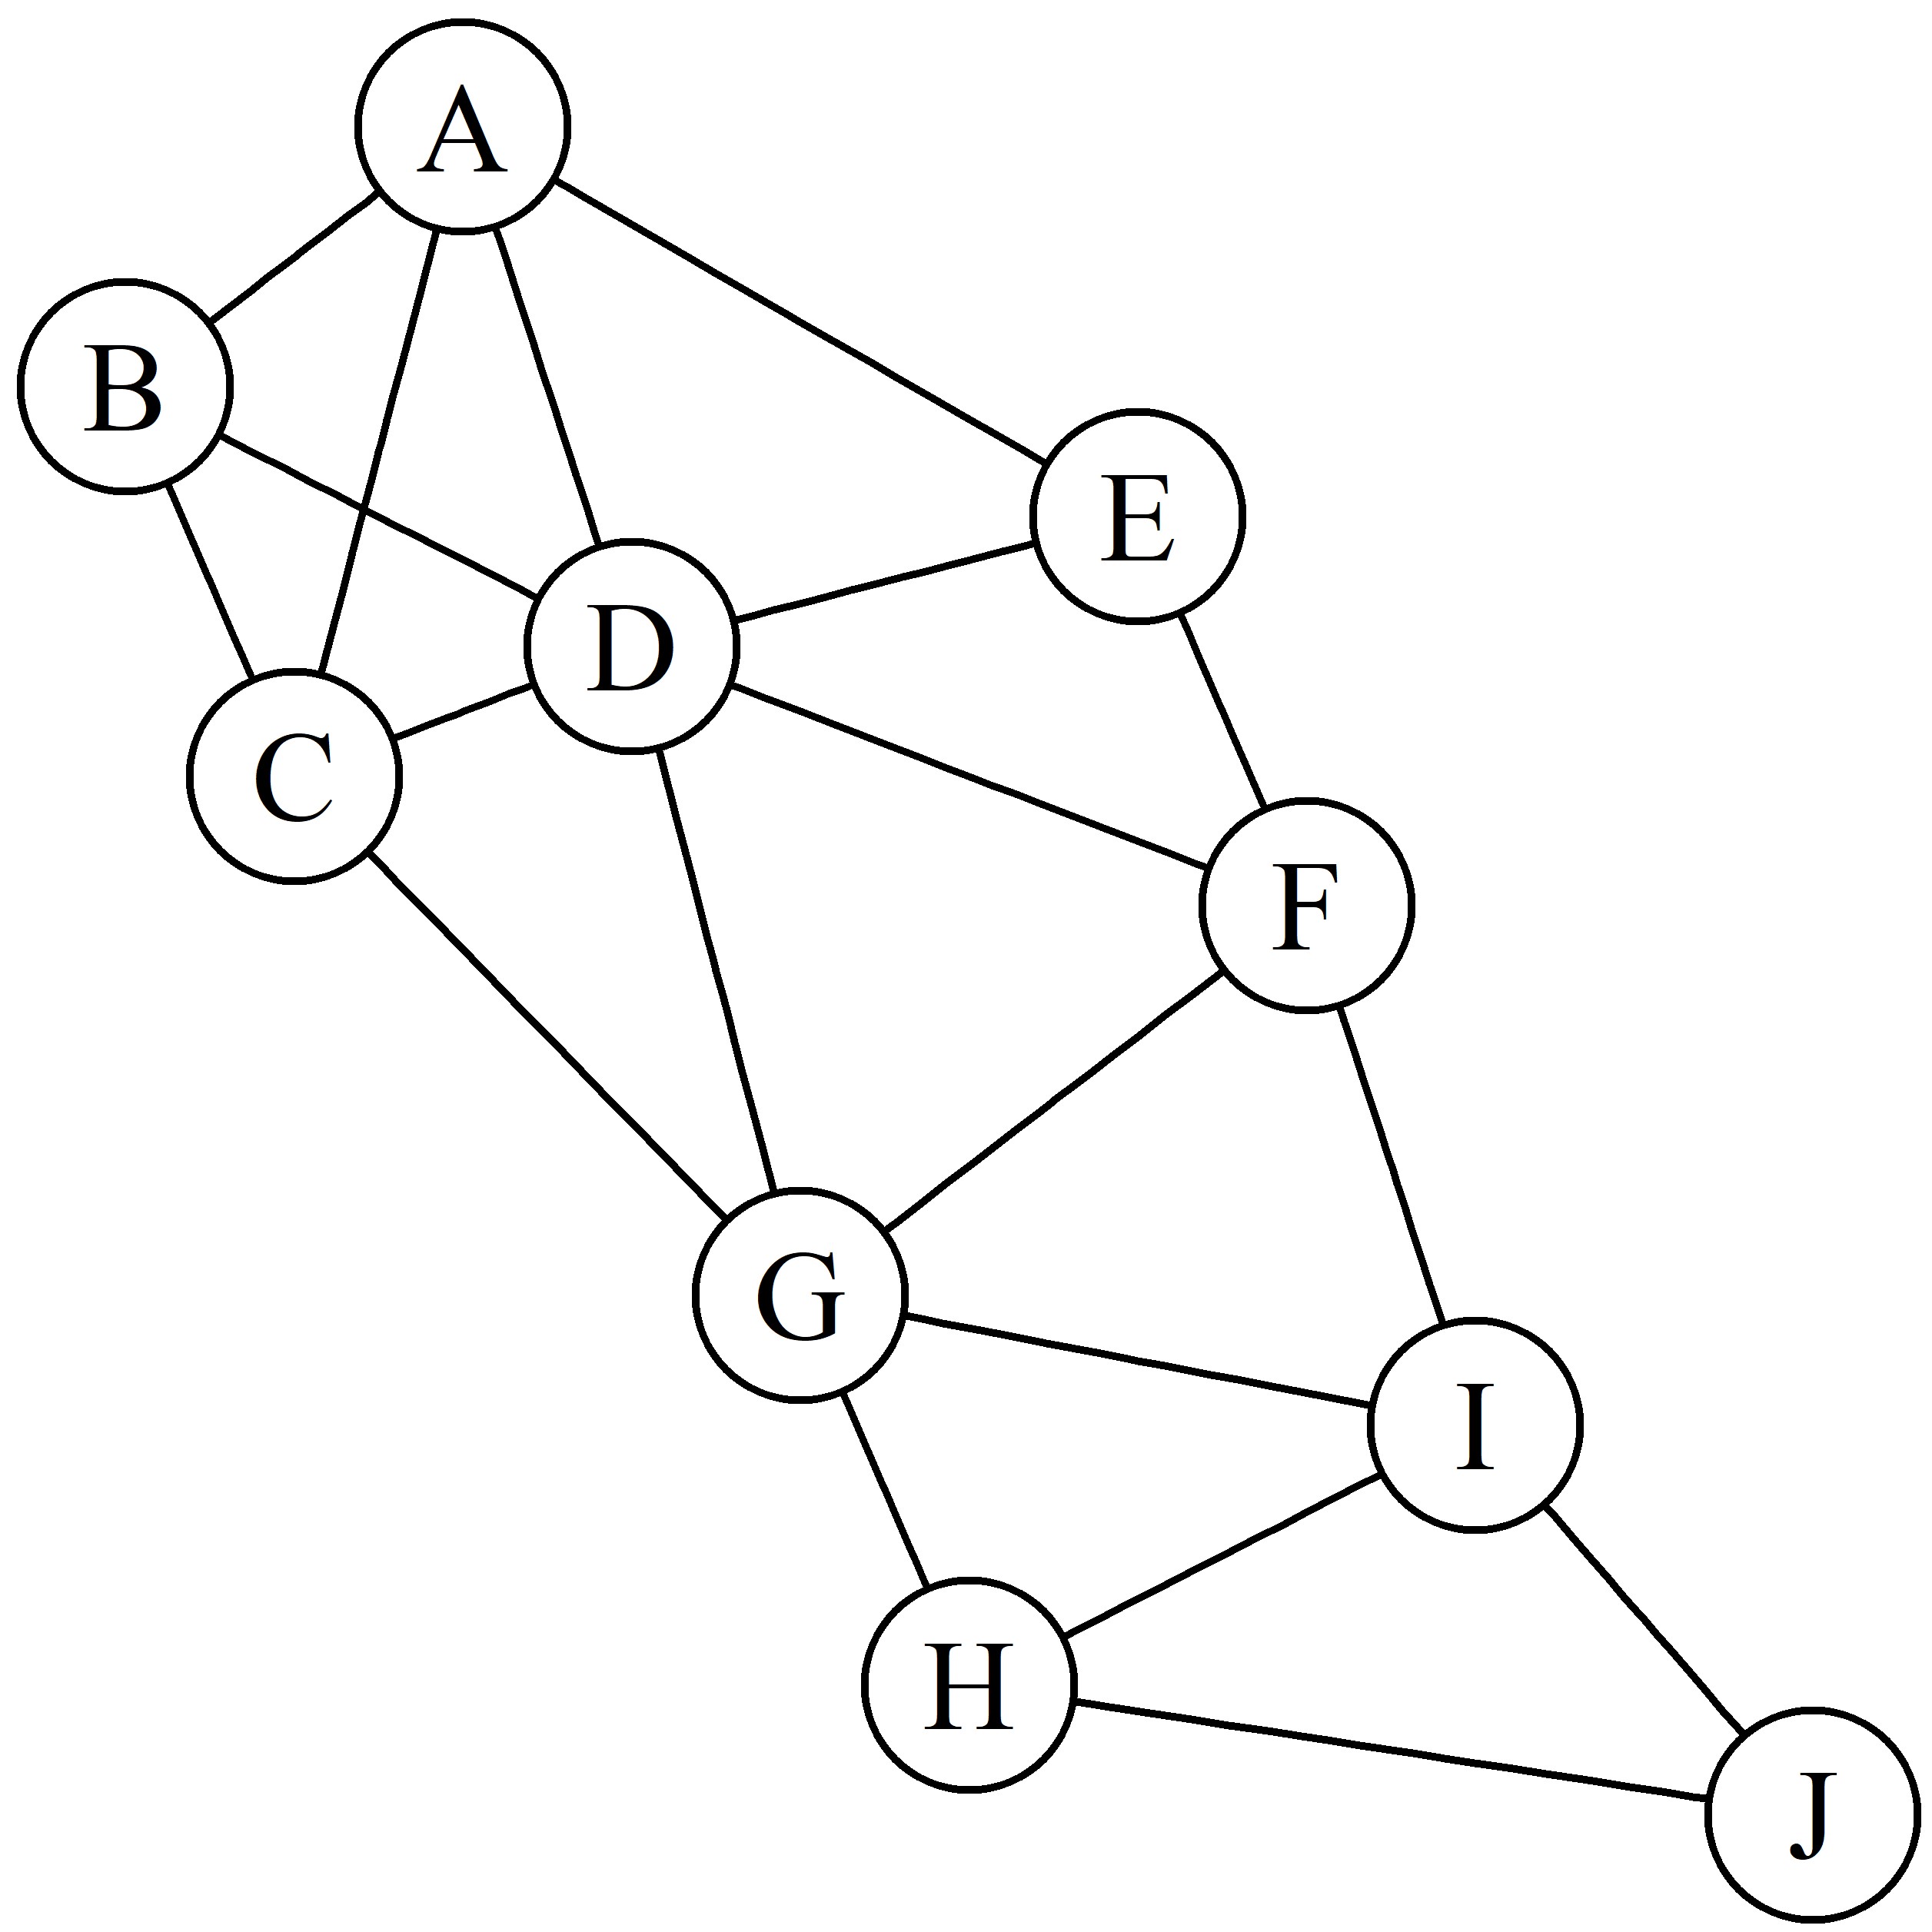
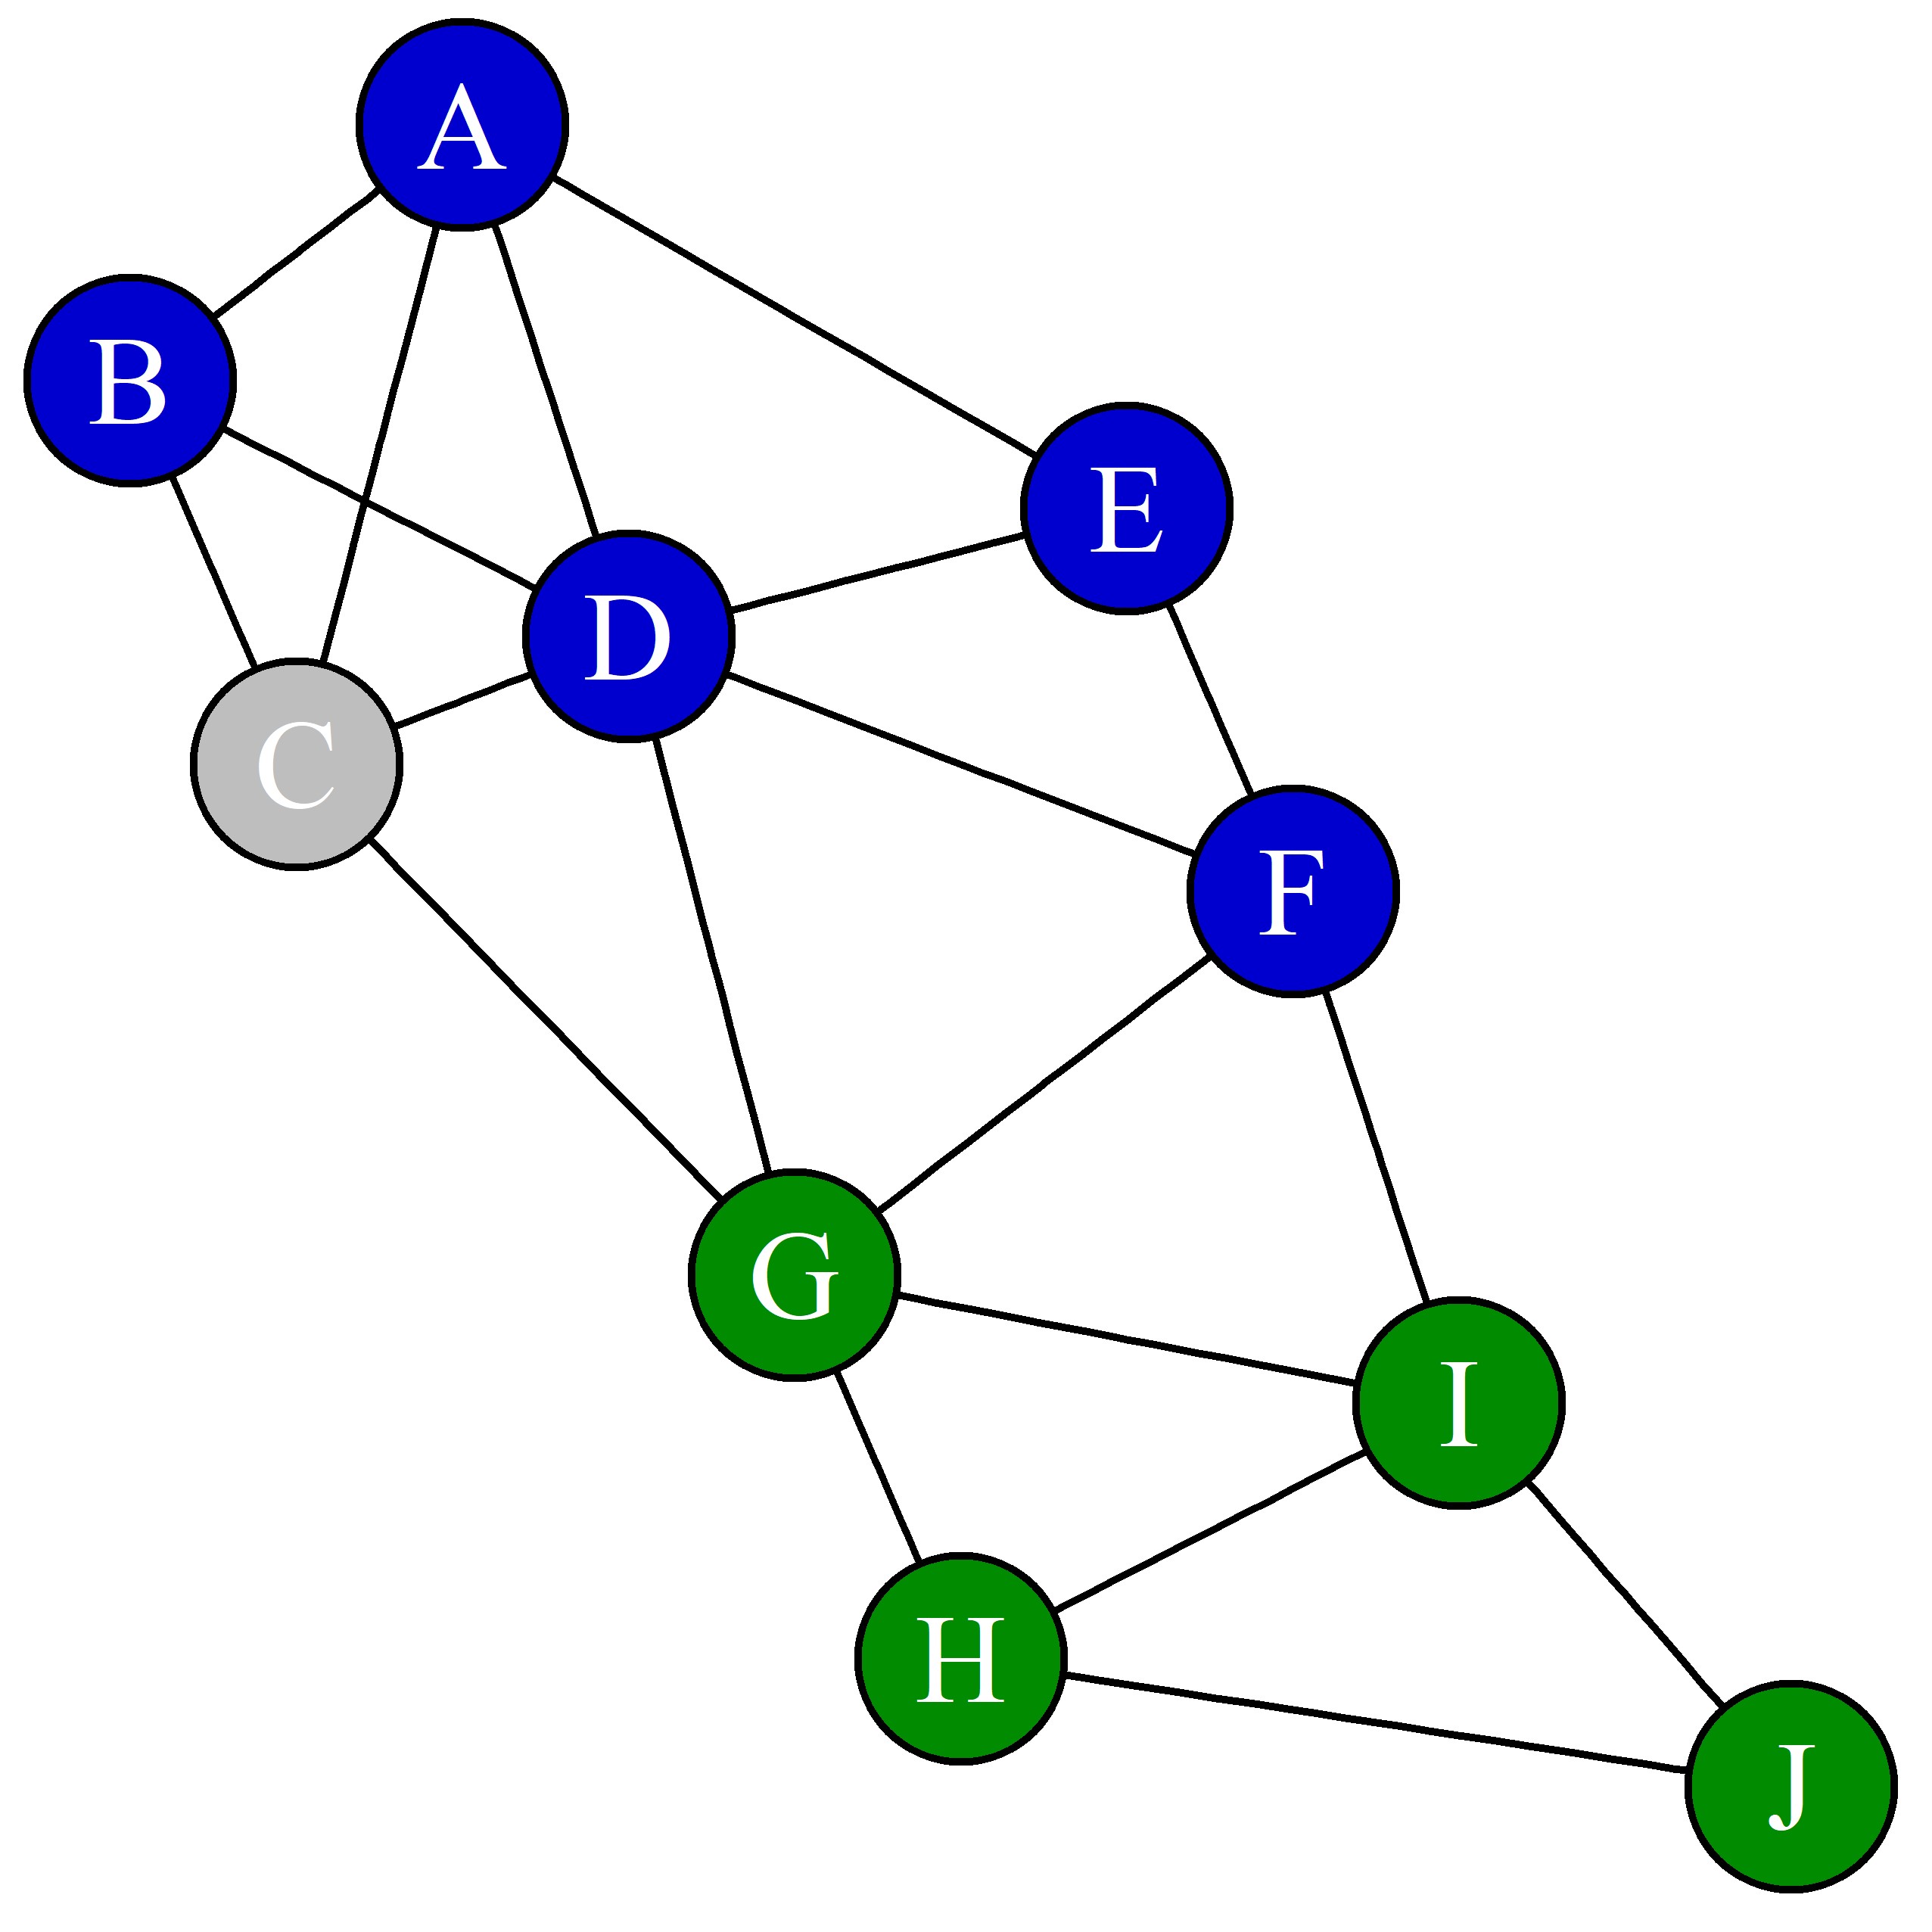
DataScienceNetwork <- data.frame(
from = c('A', 'A', 'A', 'A', 'B', 'B', 'C', 'C', 'D', 'D', 'D', 'E',
'F', 'F', 'G', 'G', 'H', 'H', 'I'),
to = c('B','C','D','E','C','D','D', 'G','E', 'F','G','F','G','I',
'I','H','I','J','J'))
g <- graph_from_data_frame(DataScienceNetwork, directed = FALSE)
pos <- cbind(c(2, 1, 1.5, 2.5, 4, 4. 5, 3, 3.5, 5, 6),
             c(10.5, 9.5, 8, 8.5, 9, 7.5, 6, 4.5, 5.5, 4))
plot.igraph(g, edge.label = NA, edge.color = 'black', layout = pos,
            vertex.label = V(g)$name, vertex.color = 'white',
            vertex.label.color = 'black', vertex.size = 25)