Challenges of network-based inference
Predictive Analytics using Networked Data in R

María Óskarsdóttir, Ph.D.
Post-doctoral researcher
First challenge
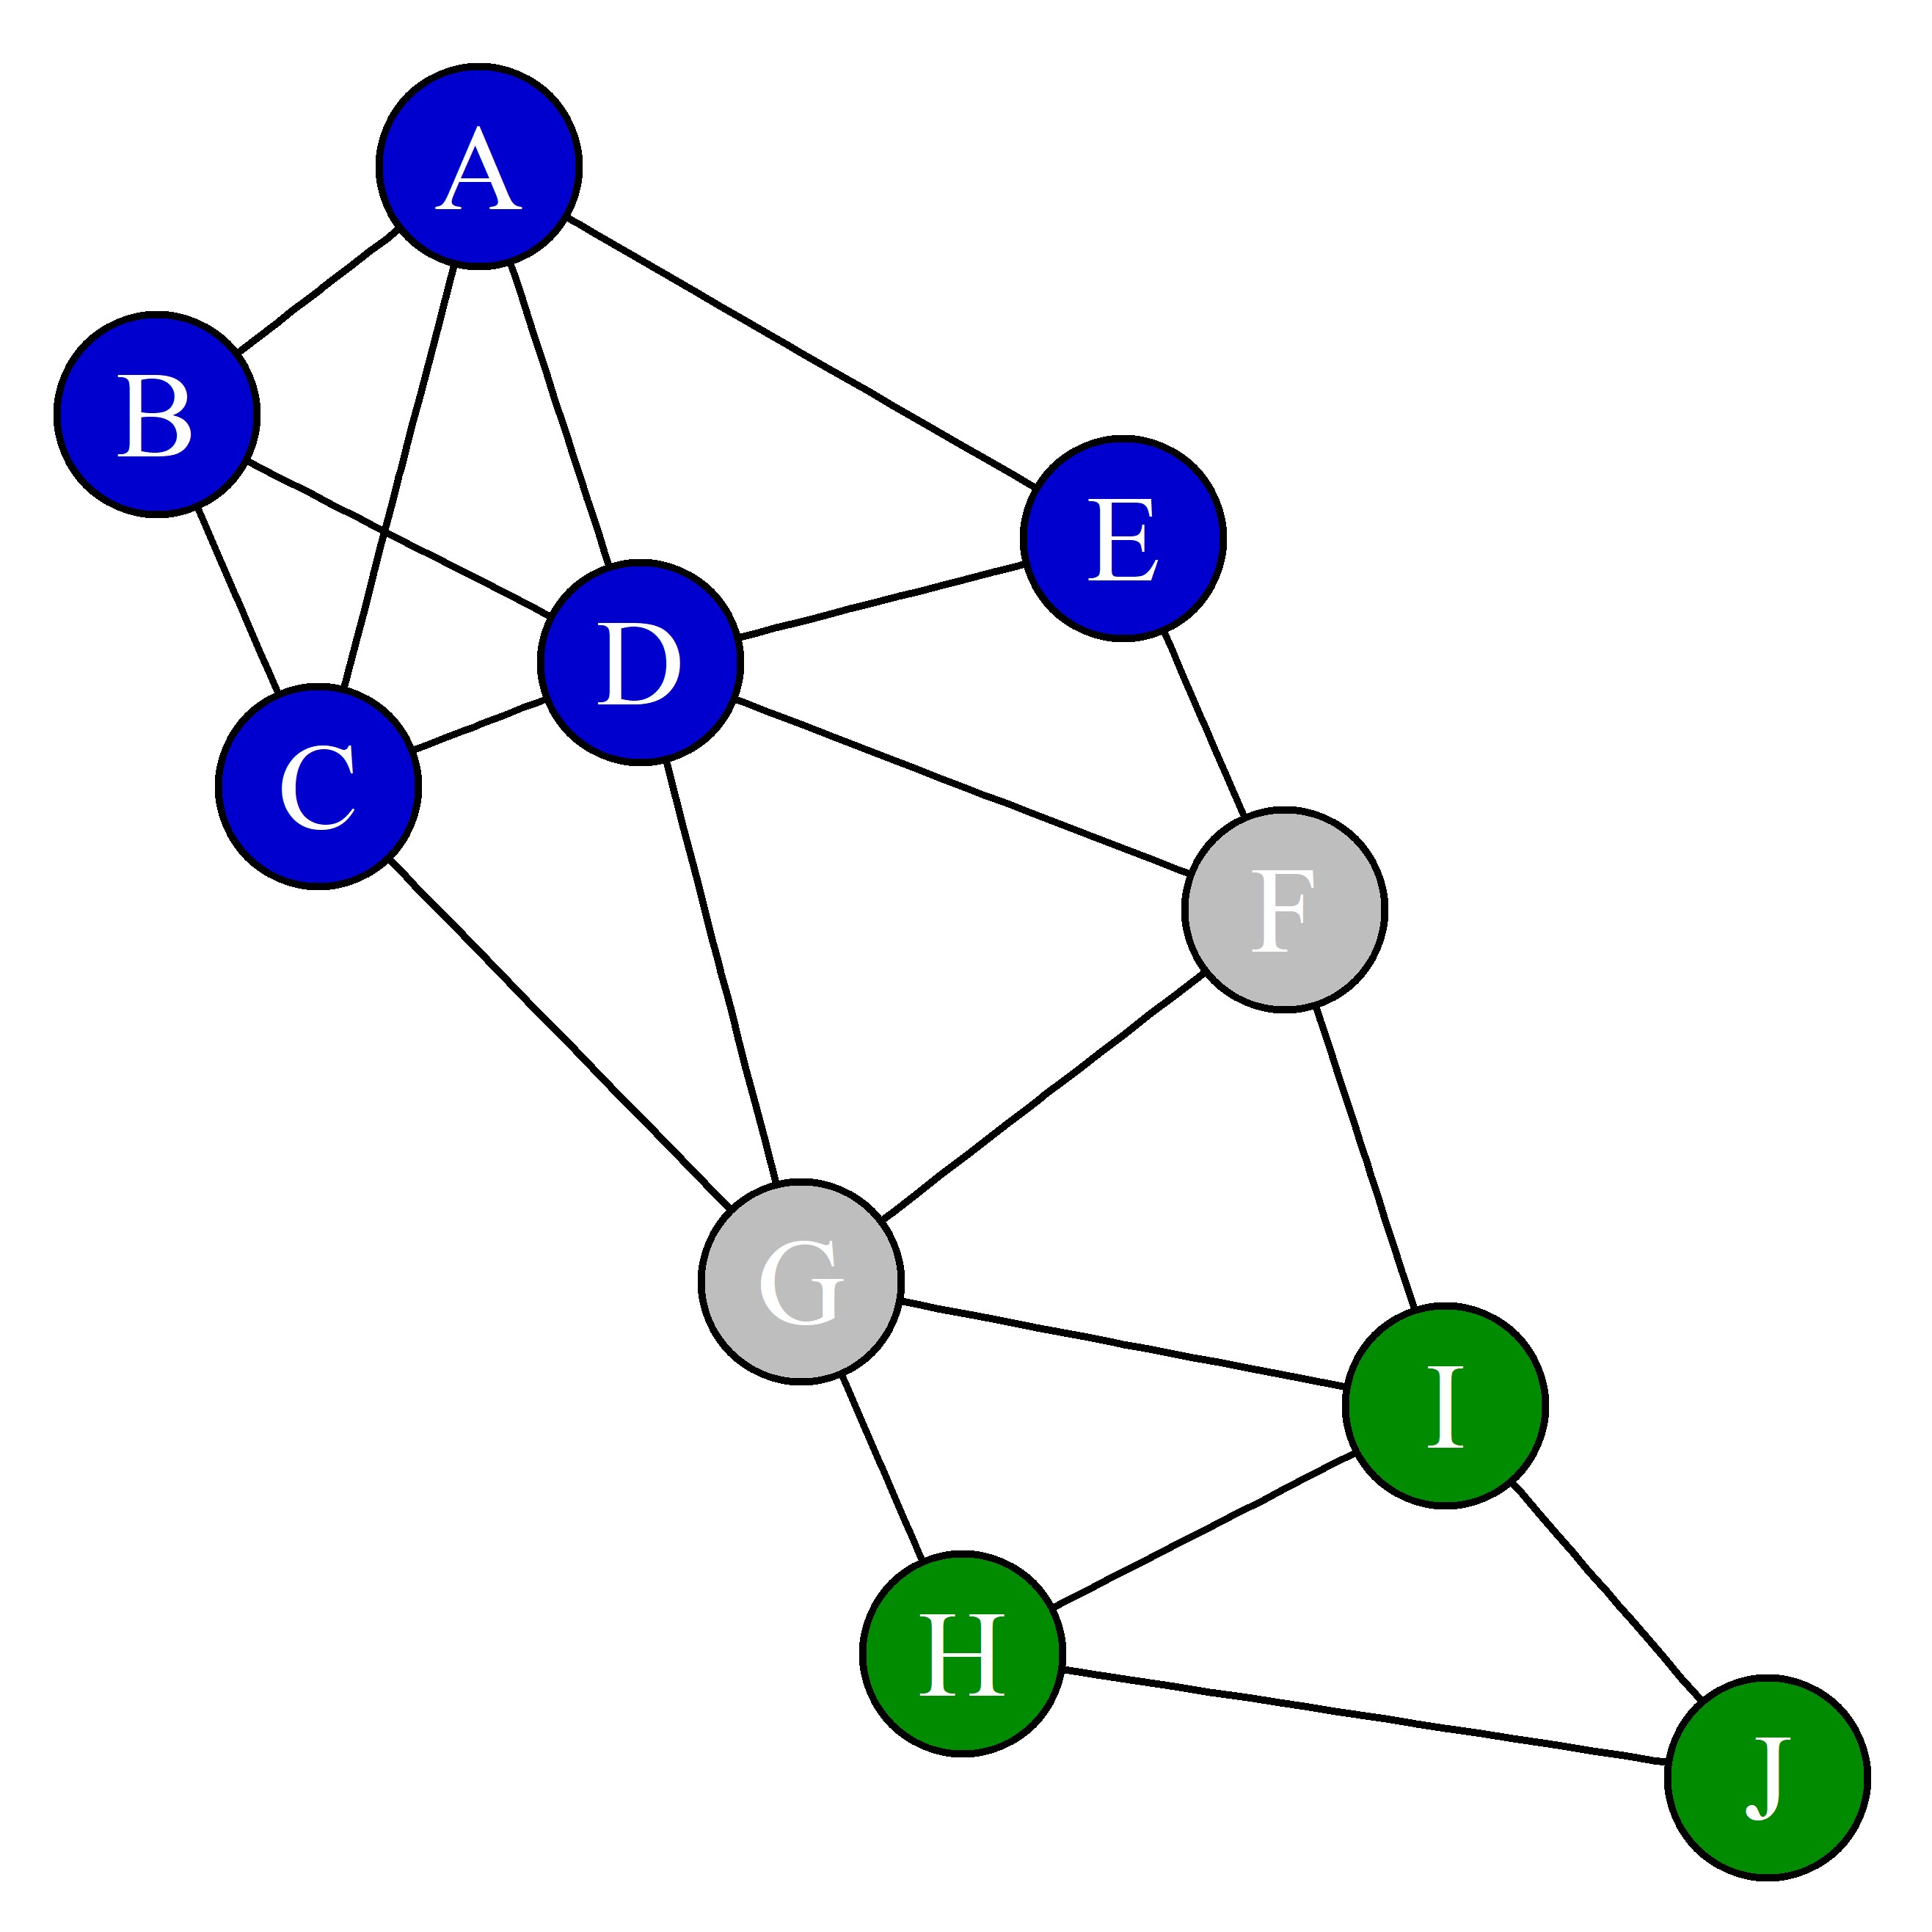
Splitting the data!
set.seed(1001)
sampleVertices <- sample(1:10, 6, replace=FALSE)
plot(induced_subgraph(g, V(g)[sampleVertices]))
plot(induced_subgraph(g, V(g)[-sampleVertices]))

Second challenge
The observations in the dataset are not independent and identically distributed (iid)

Third challenge
Collective Inference!

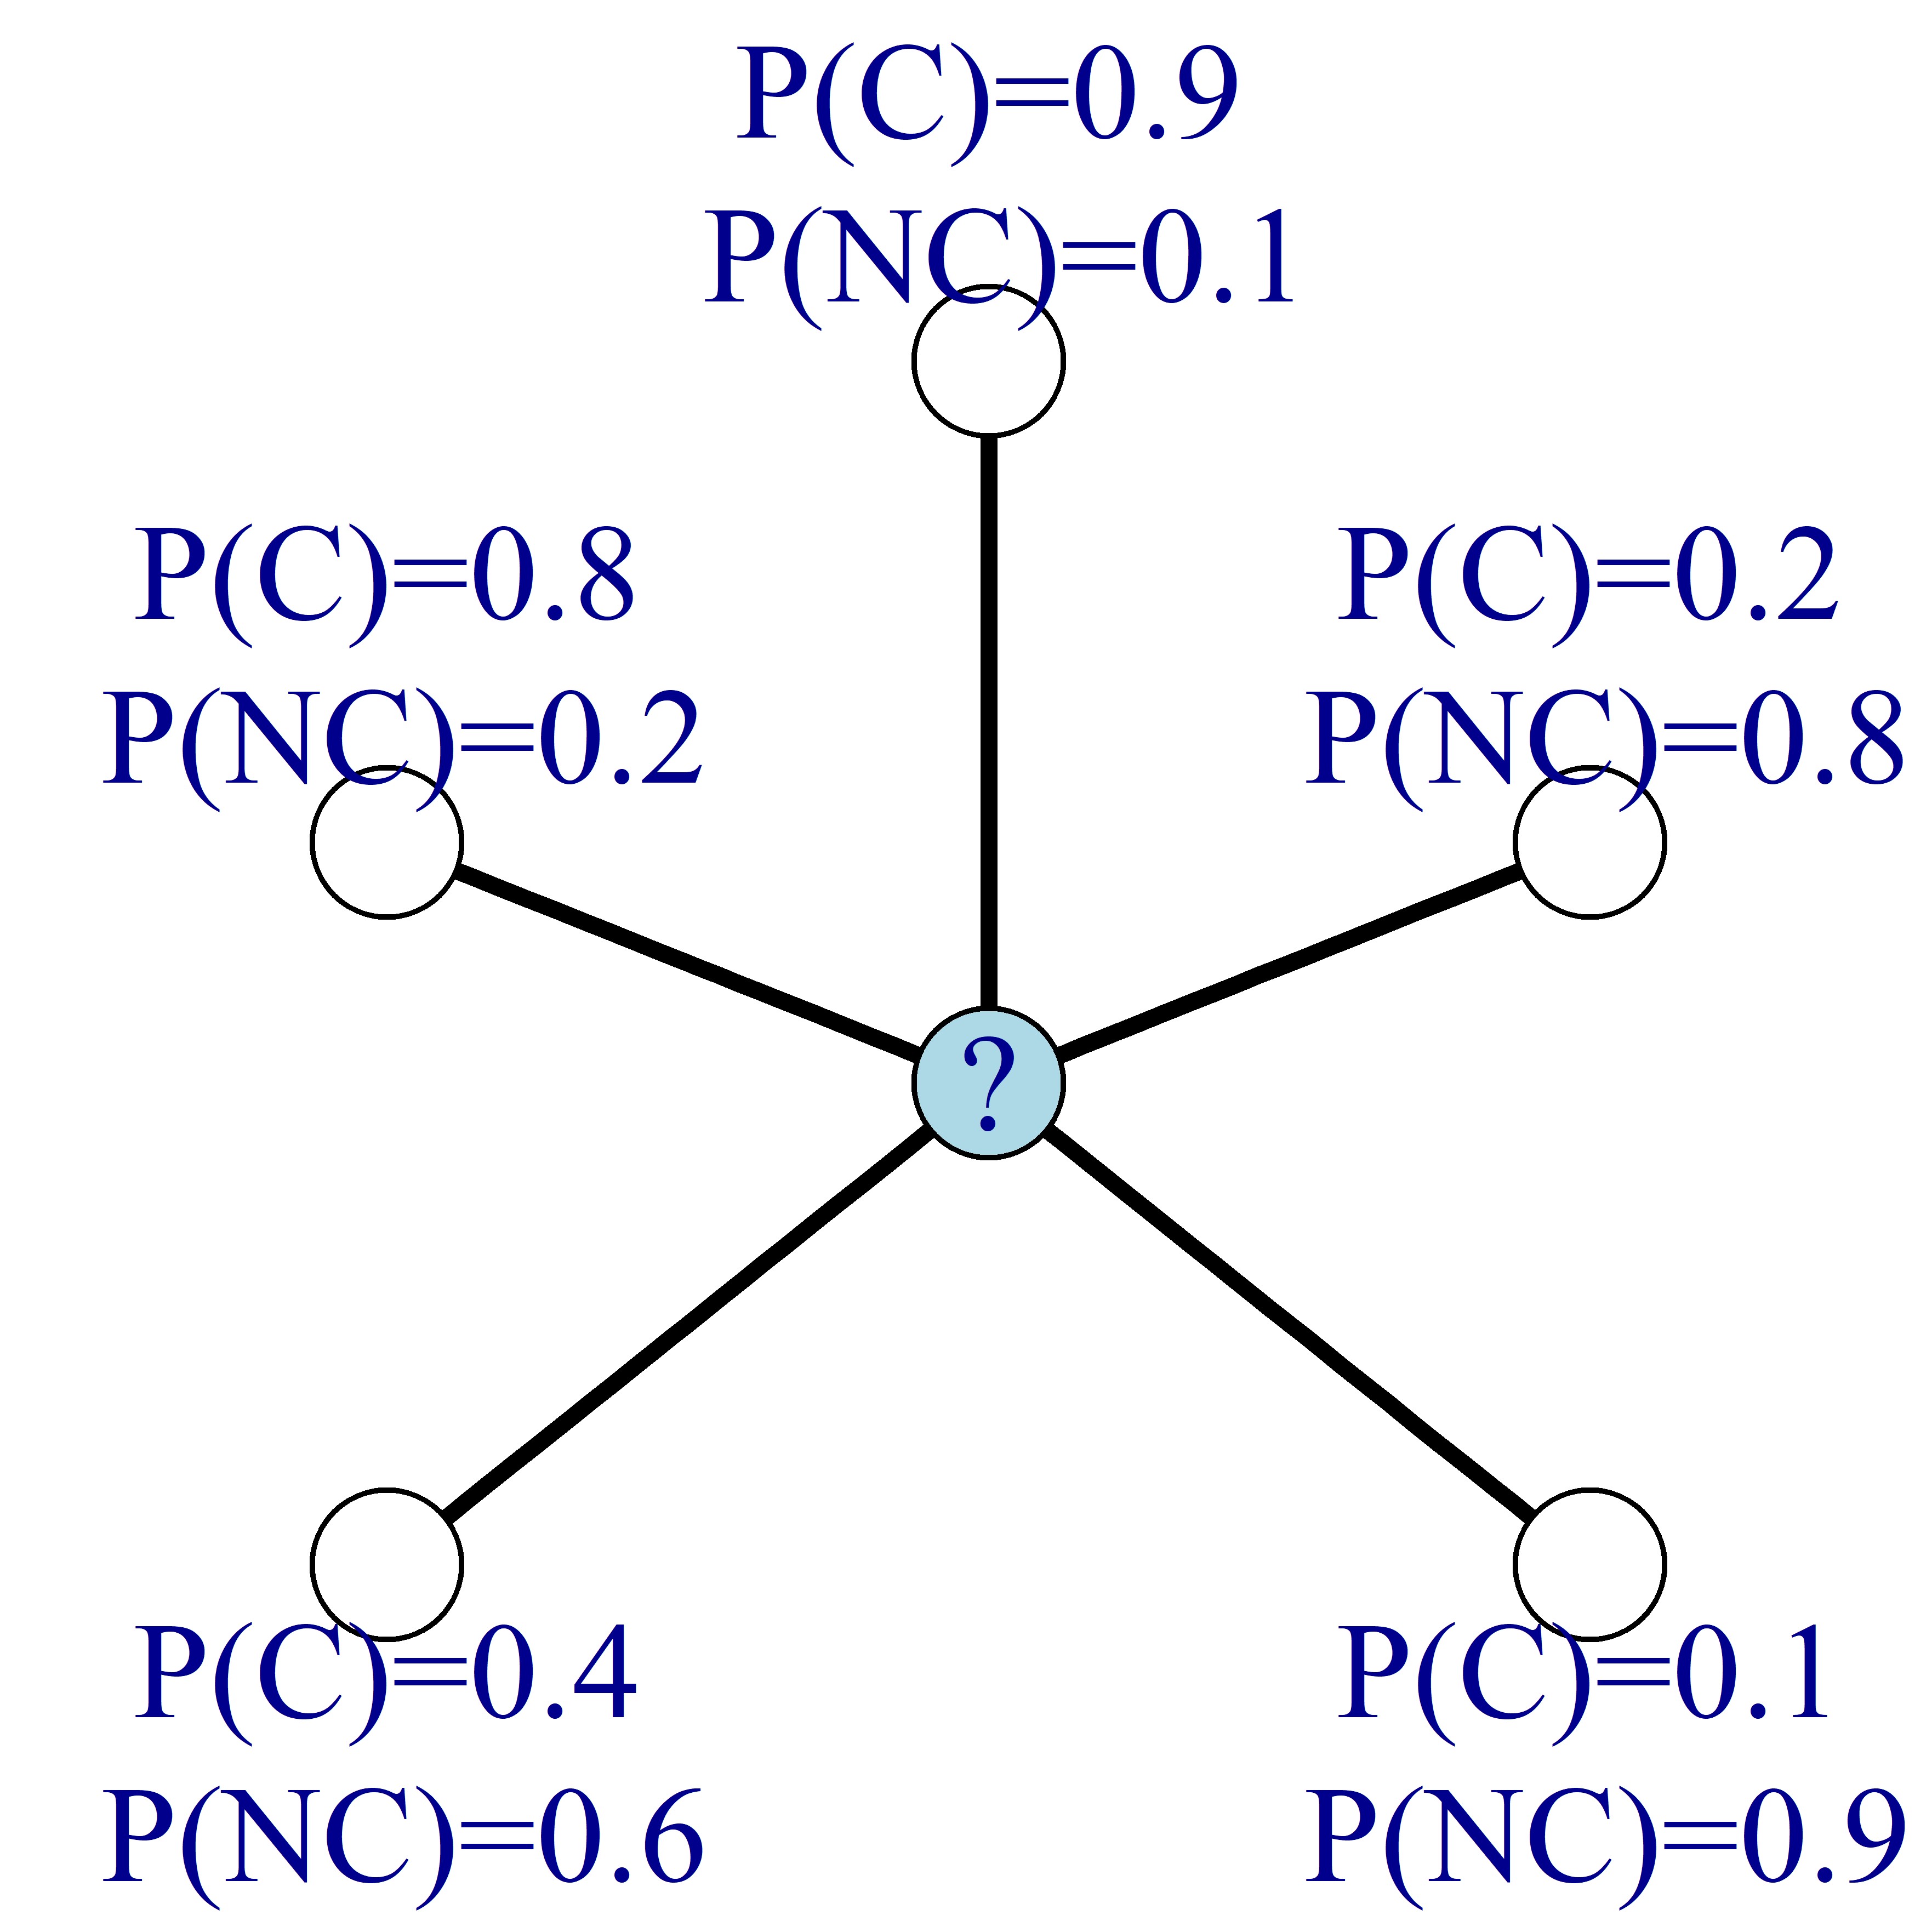
Probabilistic relational neighbor classifier

# probability churn (C)
(0.9 + 0.2 + 0.1 + 0.4 + 0.8) / 5
0.48
# probability non-churn (NC)
(0.1 + 0.8 + 0.9 + 0.6 + 0.2) / 5
0.52
Let's practice!
Predictive Analytics using Networked Data in R

