Heterophilicity
Predictive Analytics using Networked Data in R

María Óskarsdóttir, Ph.D.
Post-doctoral researcher
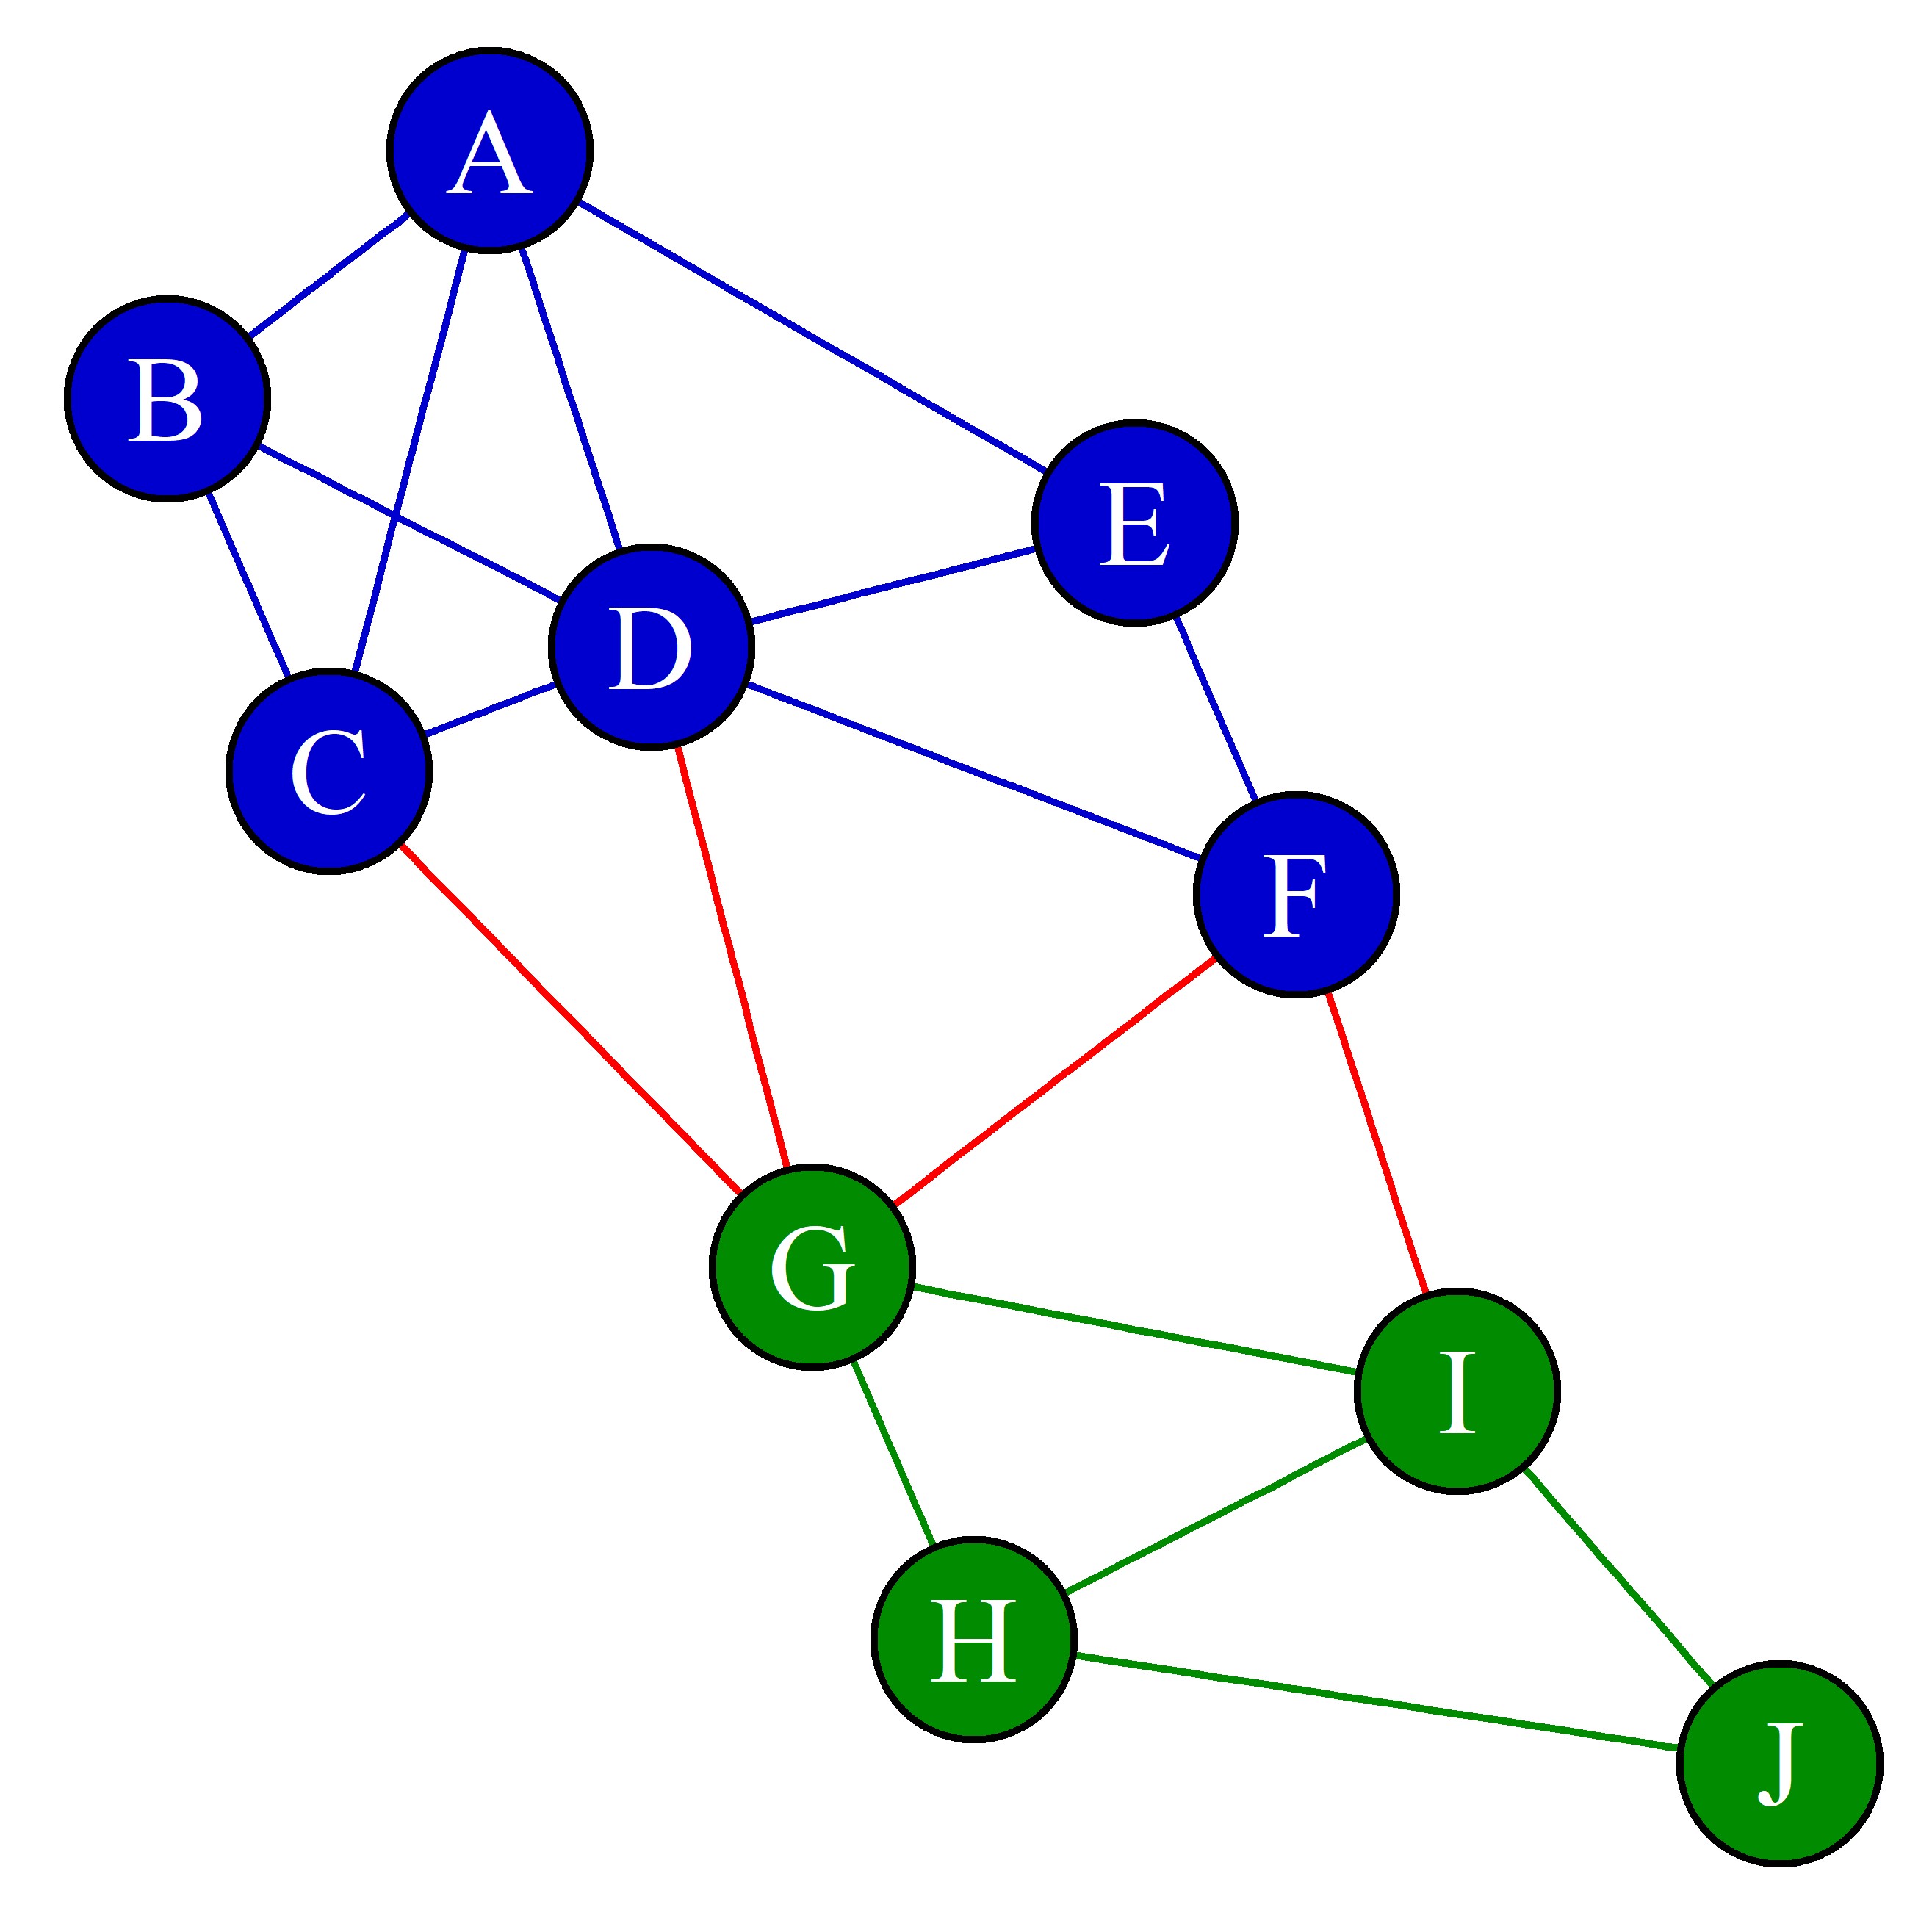
Heterophilicity
4 cross label edges
11 cross label edges
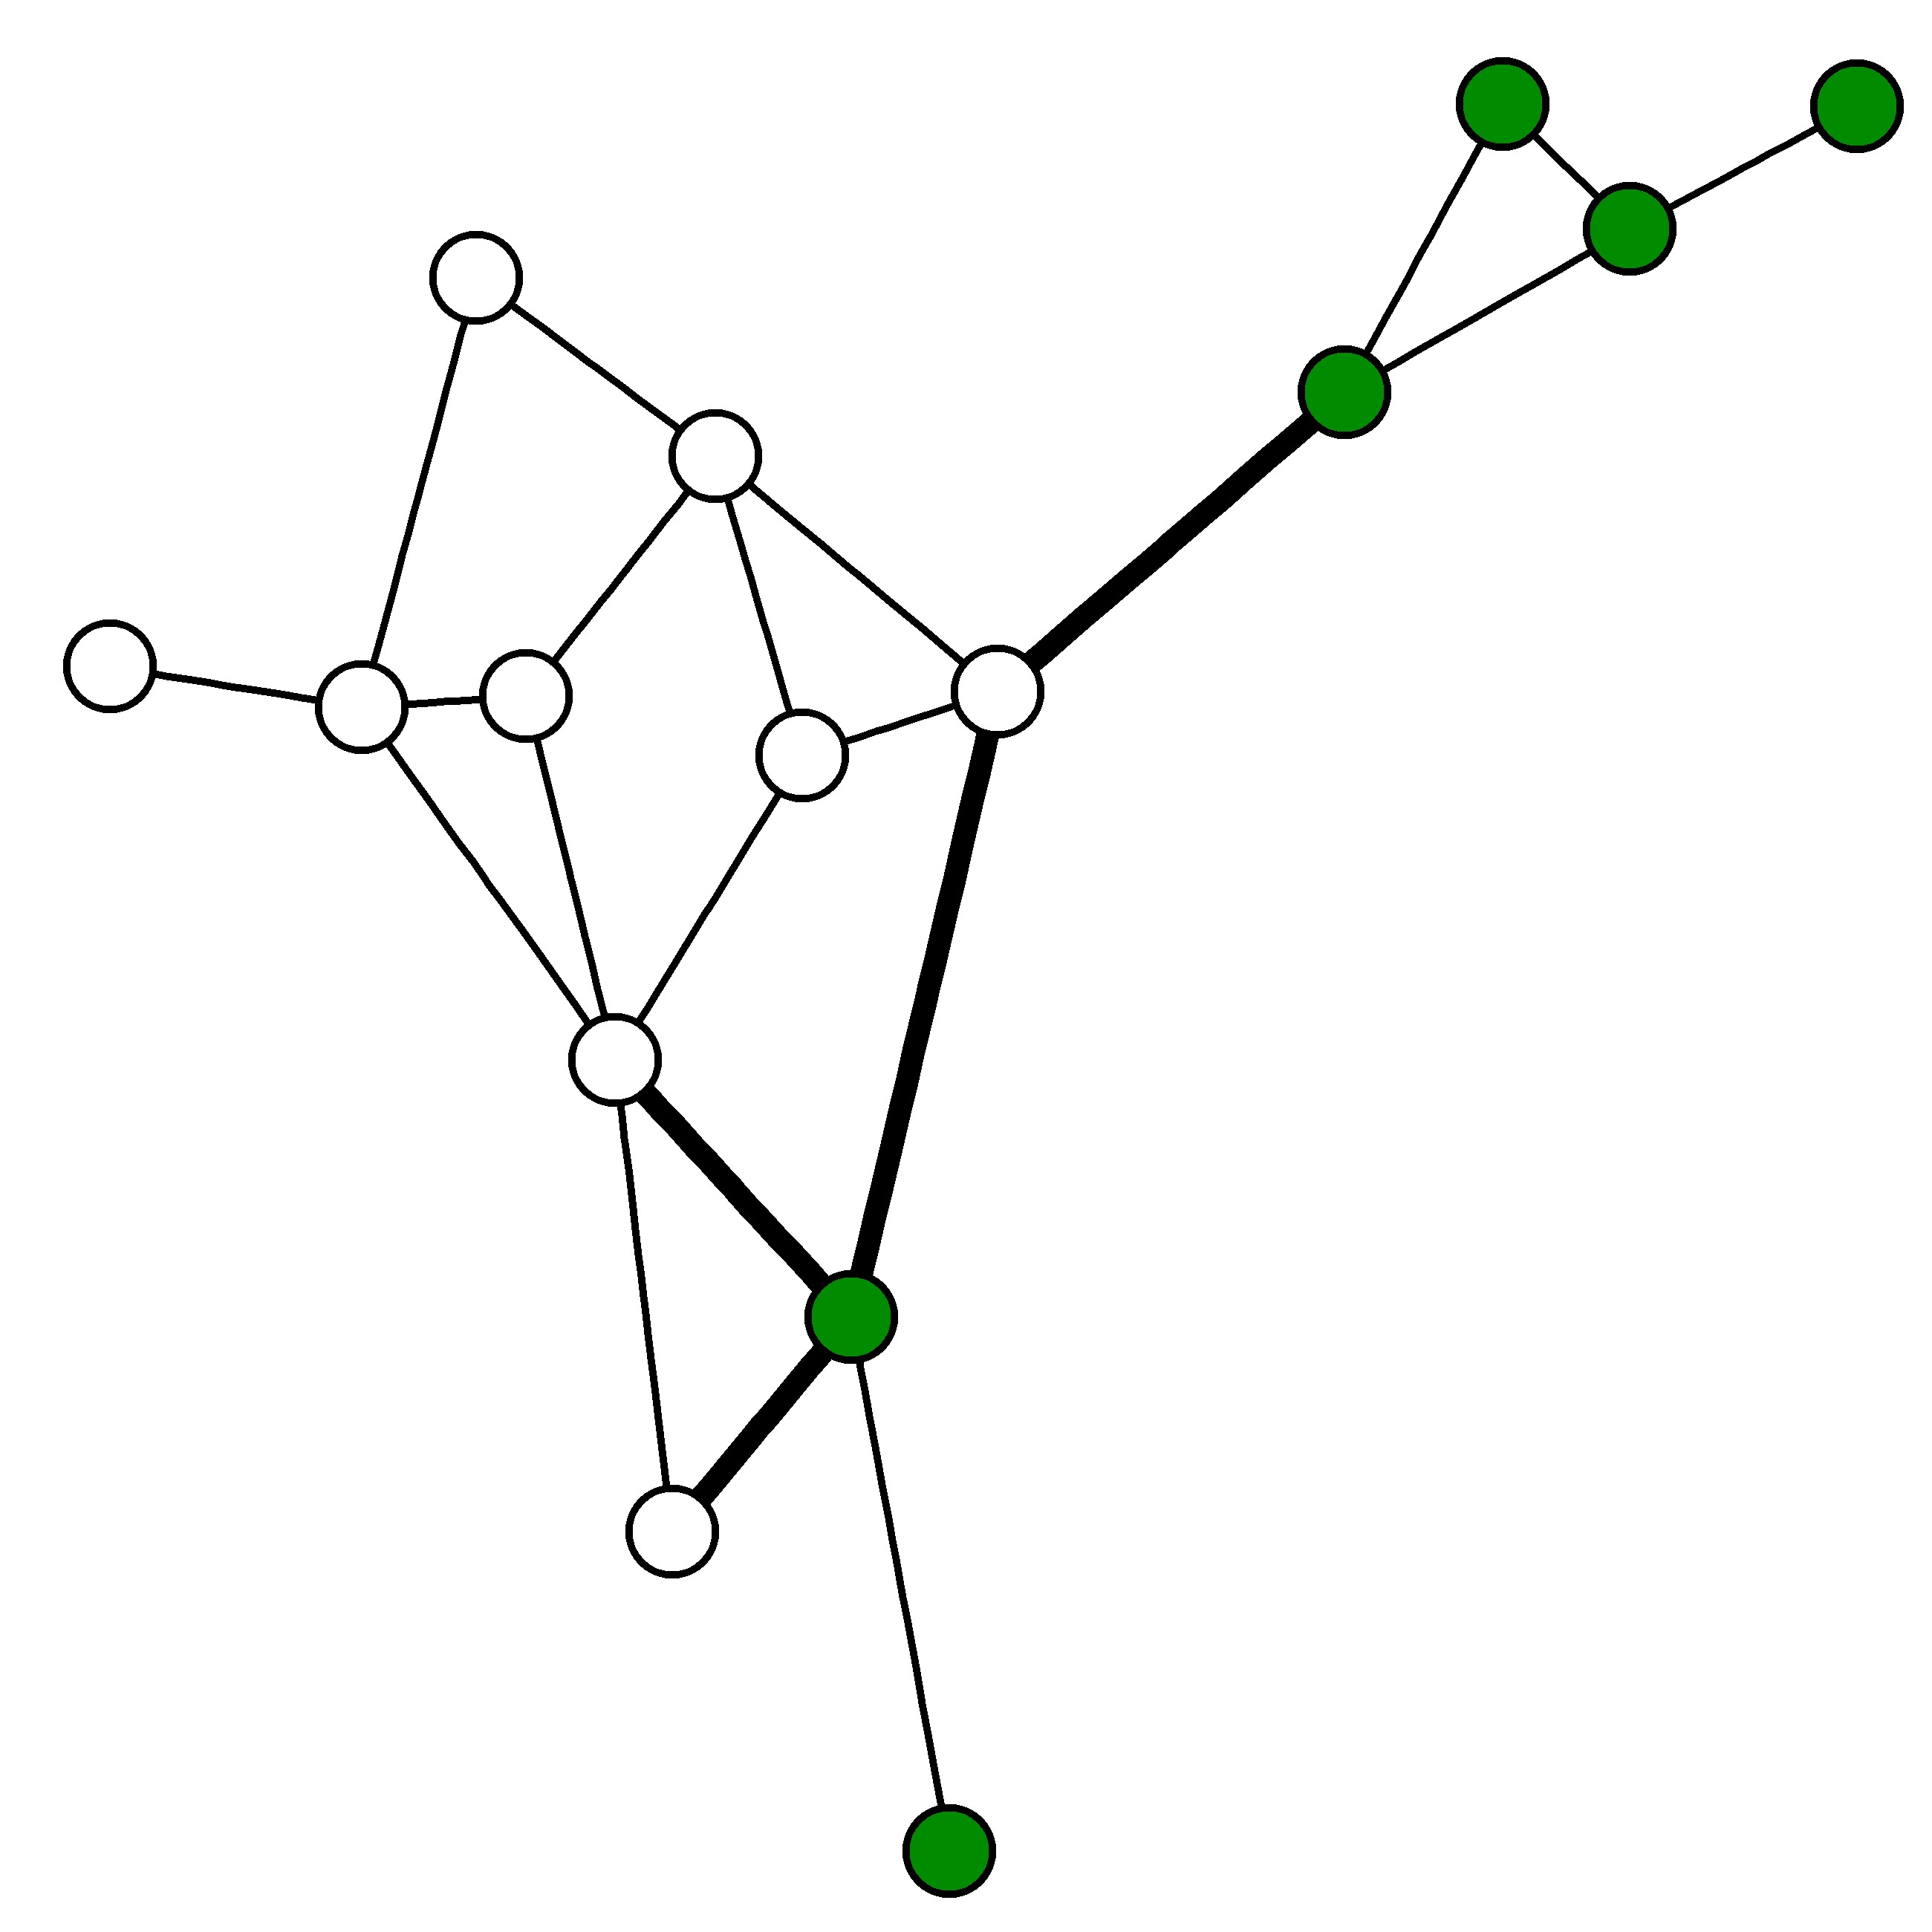
Heterophilicity
15 cross label edges
- $H=15/11=1.39$
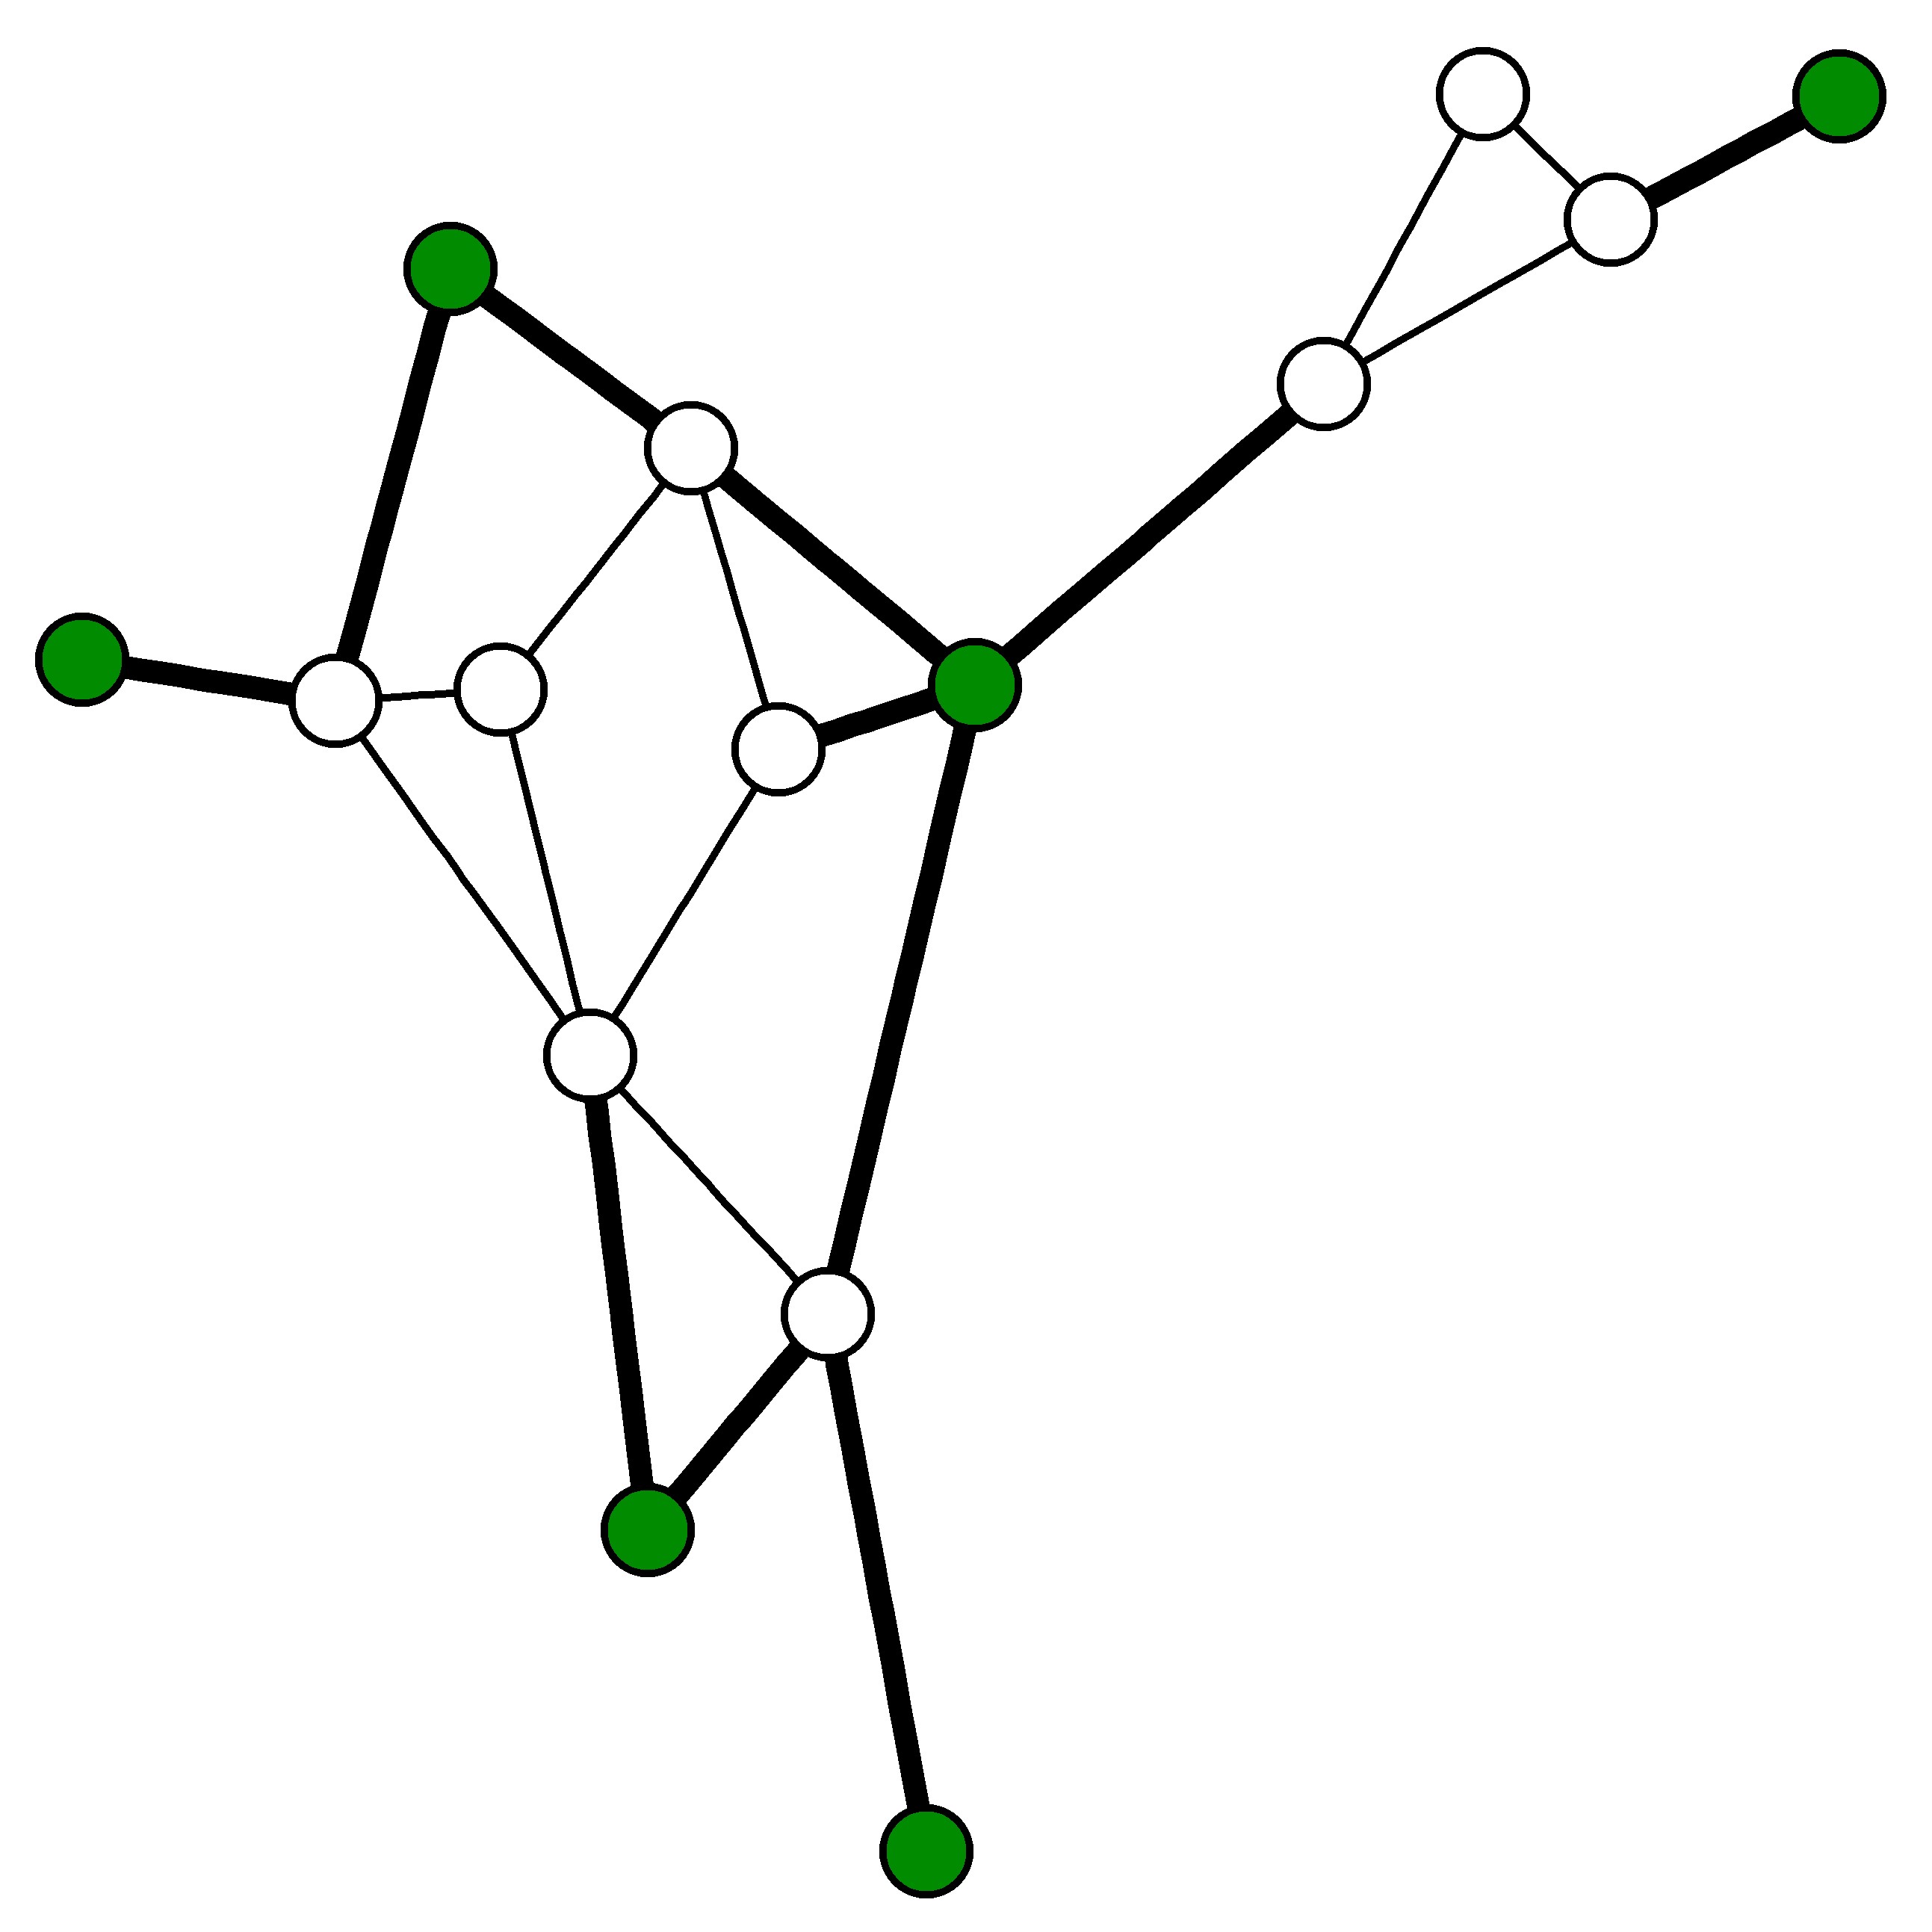
11 cross label edges
- $H=11/11=1.02$
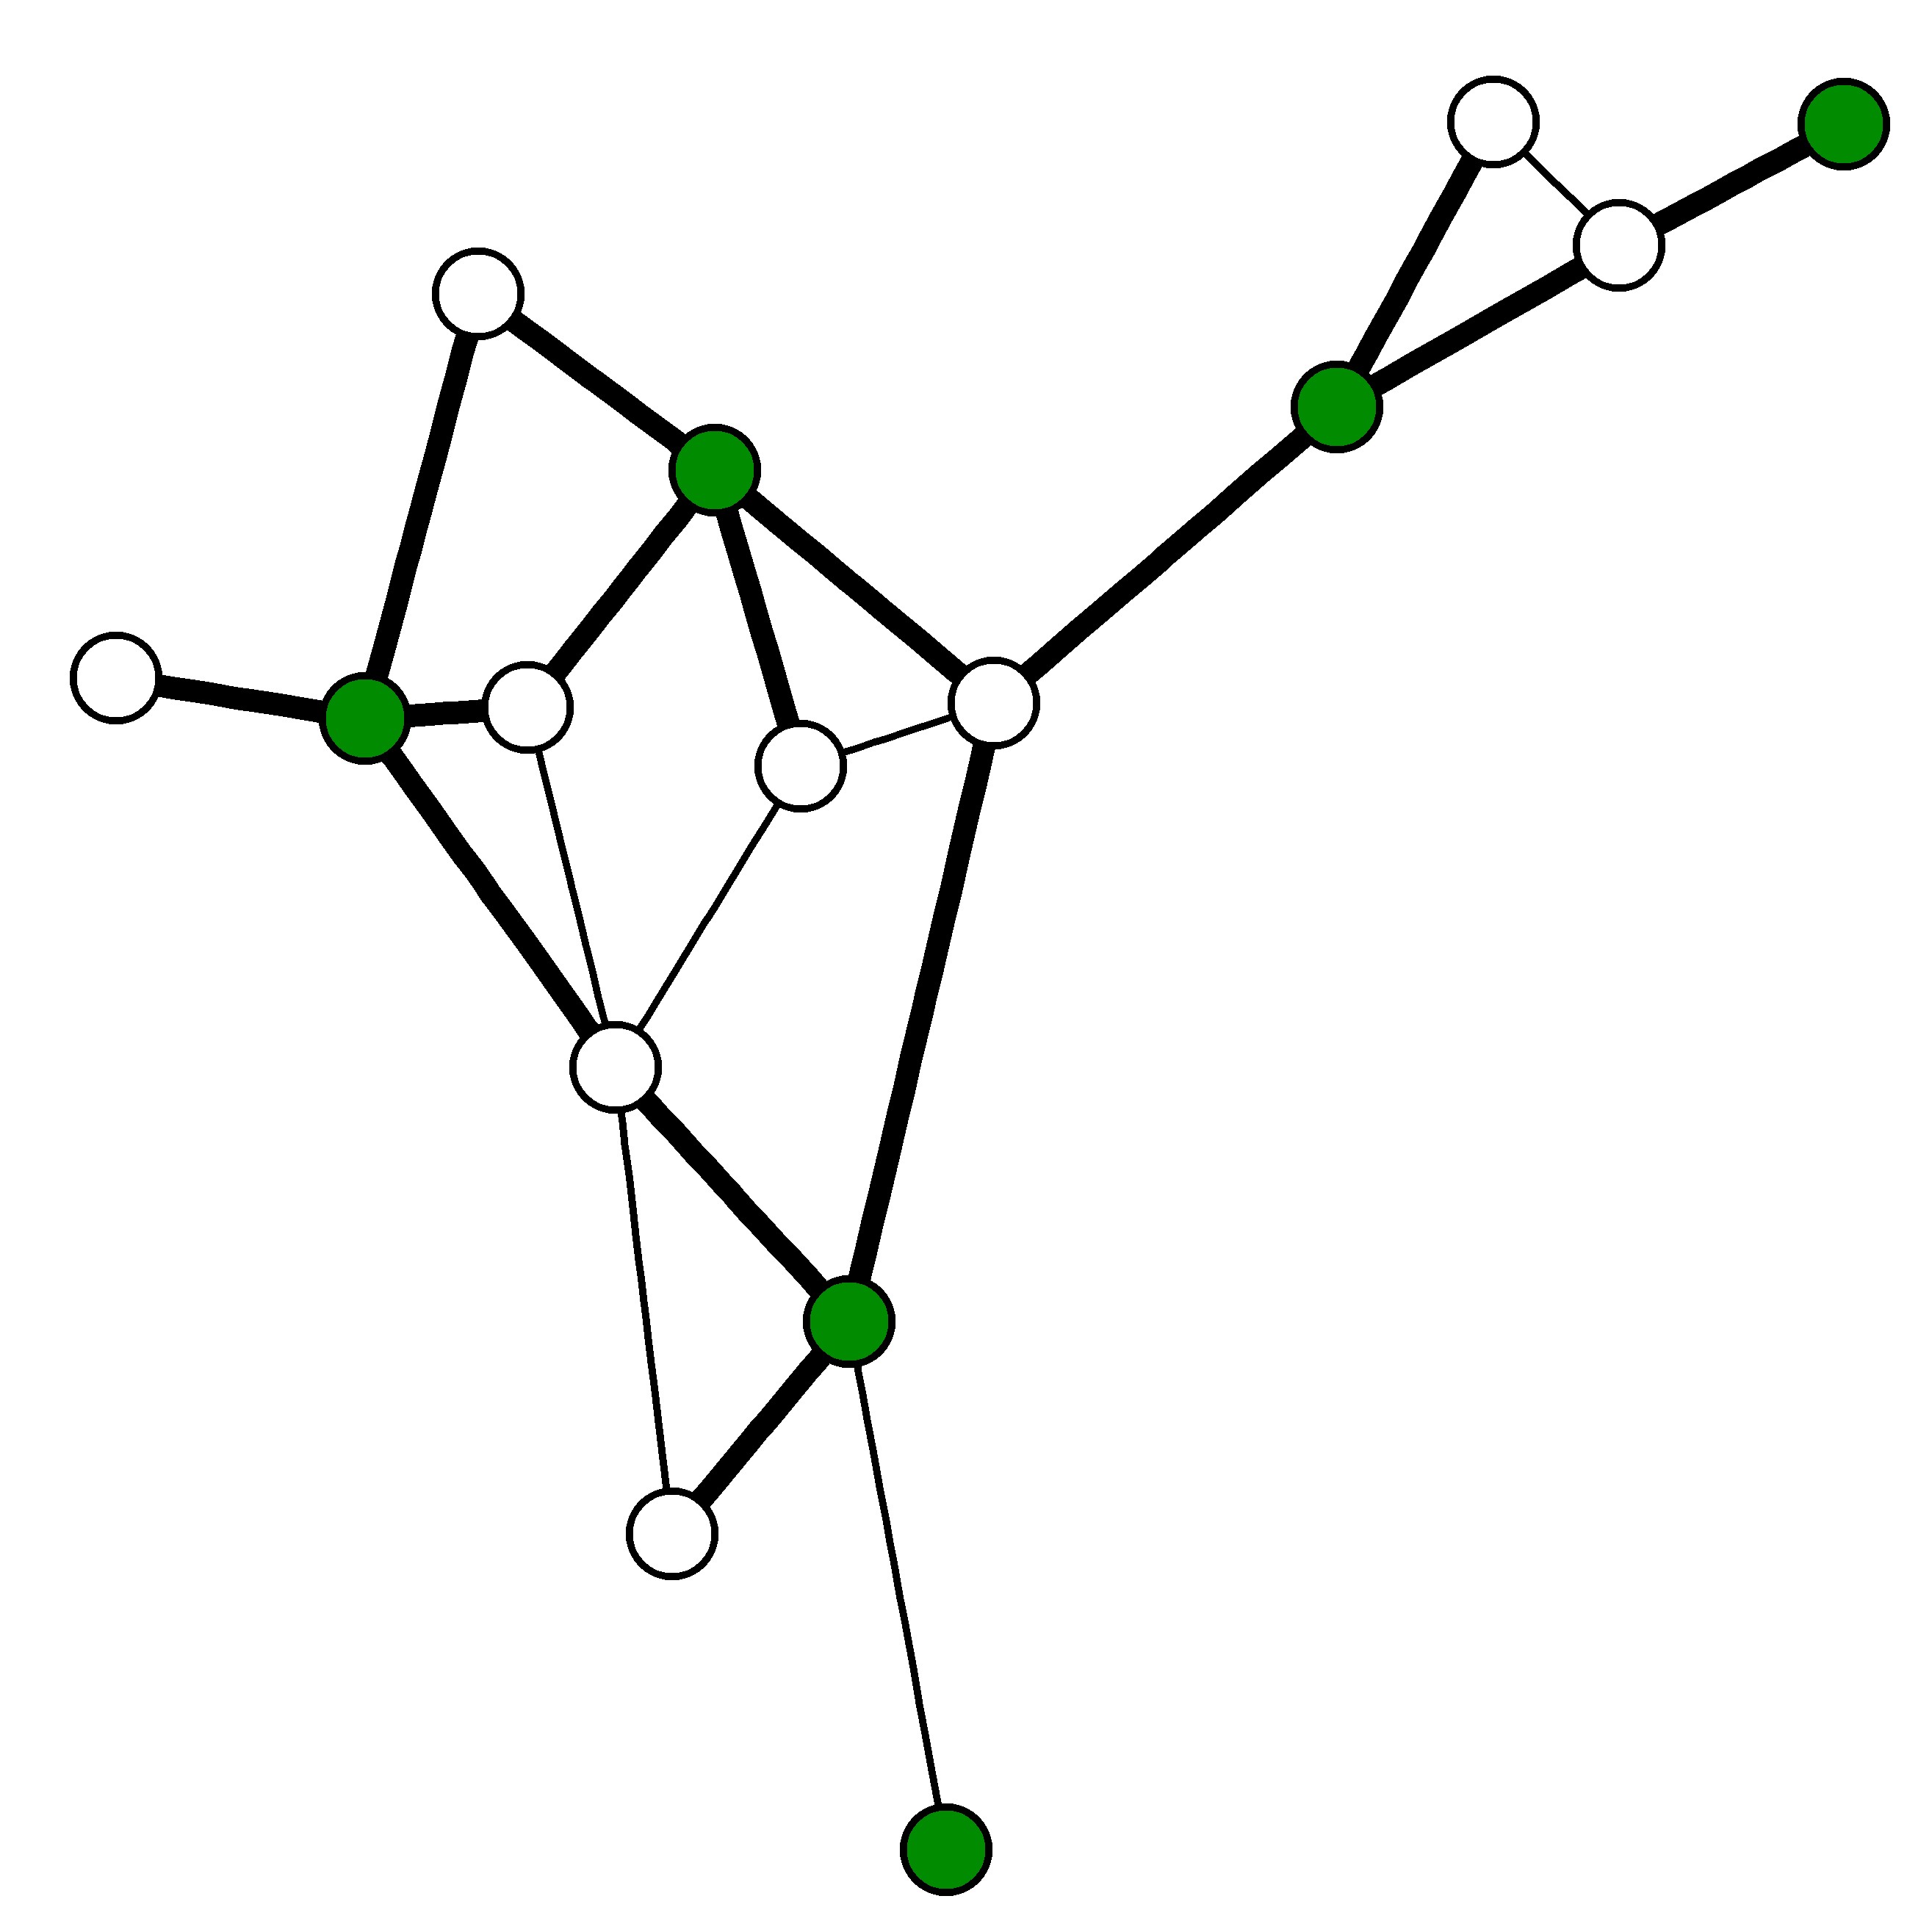
Types of Heterophilicity
$H=1.39$
$H=1.02$
$H=0.37$
Heterophilicity in the network of data scientists