Exploring and visualizing spatial data and its attributes

Working with Geospatial Data in Python

Joris Van den Bossche

Open source software developer and teacher, GeoPandas maintainer
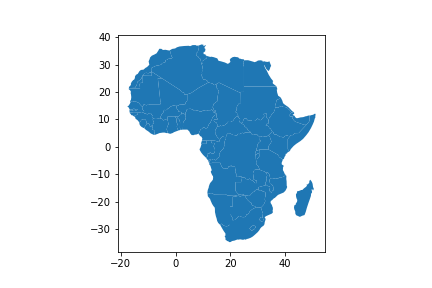
Filtering data

countries.head()
          name      continent       gdp                            geometry
0  Afghanistan           Asia   64080.0  POLYGON ((61.21 35.65, 62.23 35...
1       Angola         Africa  189000.0  MULTIPOLYGON (((23.90 -11.72, 2...
...
countries['continent'] == 'Africa'
0      False
1       True
         ...  
175     True
176     True
Name: continent, Length: 177, dtype: bool
Working with Geospatial Data in Python

Filtering data

countries_africa = countries[countries['continent'] == 'Africa']
countries_africa.plot()

Working with Geospatial Data in Python

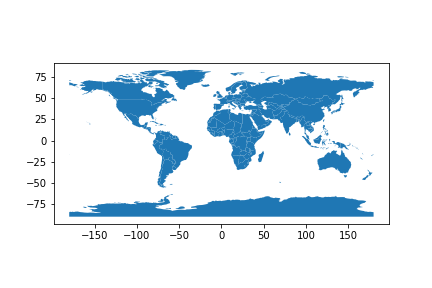
Visualizing spatial data

countries.plot()

Working with Geospatial Data in Python

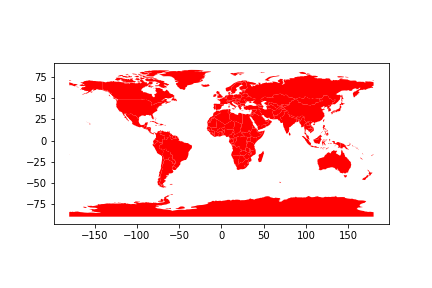
Adjusting the color: uniform color

countries.plot(color="red")

Working with Geospatial Data in Python

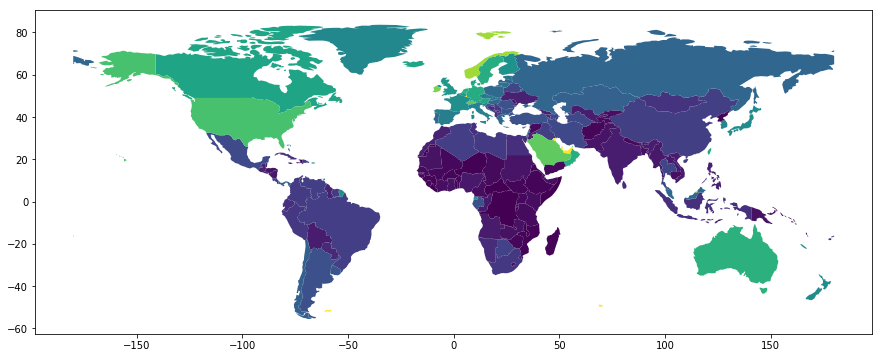
Adjusting the color: based on attribute values

countries.plot(column='gdp_per_cap')
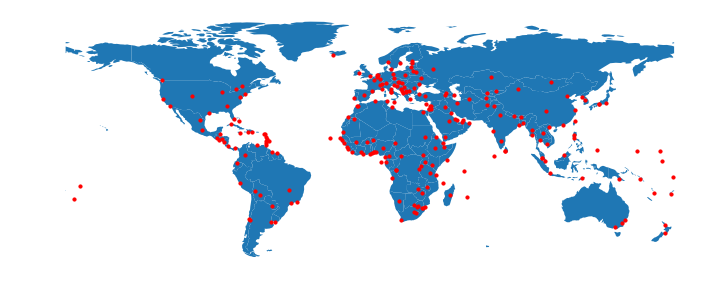
Working with Geospatial Data in Python

Multi-layered plot

fig, ax = plt.subplots(figsize=(12, 6))
countries.plot(ax=ax)
cities.plot(ax=ax, color='red', markersize=10)
ax.set_axis_off()

Working with Geospatial Data in Python

Let's practice!

Working with Geospatial Data in Python

Preparing Video For Download...